| Red | Green | Blue | |
| z | 17.64 | ||
| znorm | Inf | ||
| sky | -NaN | -NaN | -Inf |
| S/N | 30.4 | 43.5 | 42.1 |
| S/N(c) | 0.0 | 0.0 | 0.0 |
| SN(E/C) |
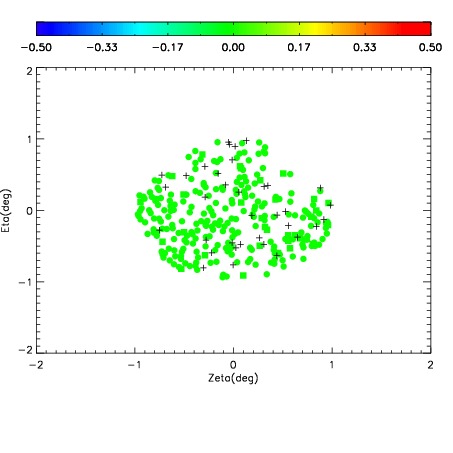
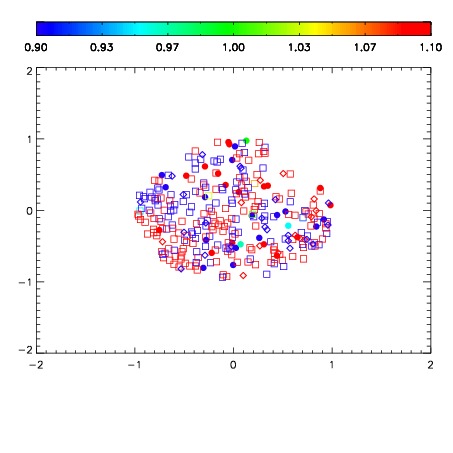
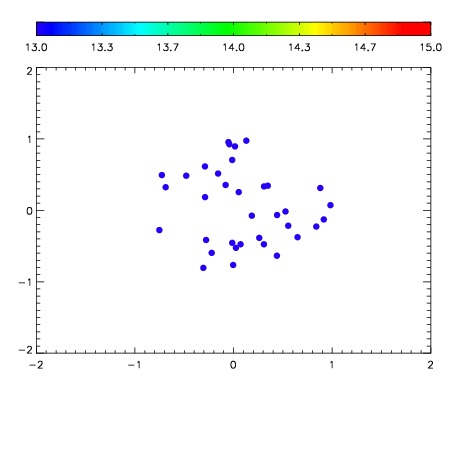

| Frame | Nreads | Zeropoints | Mag plots | Spatial mag deviation | Spatial sky 16325A emission deviations (filled: sky, open: star) | Spatial sky continuum emission | Spatial sky telluric CO2 absorption deviations (filled: H < 10) | |||||||||||||||||||||||
| 0 | 0 |
|
|
|
|
|
|
| IPAIR | NAME | SHIFT | NEWSHIFT | S/N | NAME | SHIFT | NEWSHIFT | S/N |
| 0 | 11950082 | 0.499639 | 0.00000 | 184.952 | 11950083 | -0.00172483 | 0.501364 | 185.592 |
| 1 | 11950086 | 0.497422 | 0.00221699 | 192.927 | 11950087 | -0.00390975 | 0.503549 | 197.723 |
| 2 | 11950081 | 0.499465 | 0.000174016 | 183.889 | 11950084 | -0.00175041 | 0.501389 | 175.825 |
| 3 | 11950085 | 0.498359 | 0.00128001 | 175.251 | 11950080 | 0.00000 | 0.499639 | 168.040 |