| Frame | Nreads | Zeropoints | Mag plots
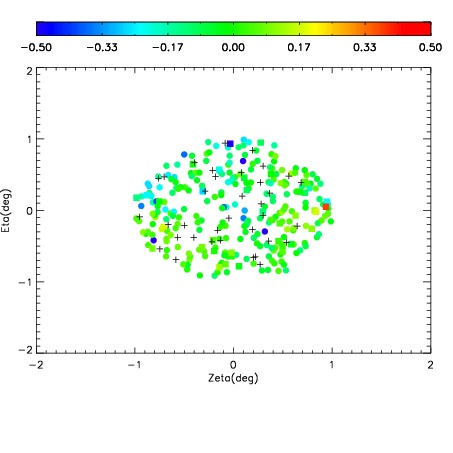
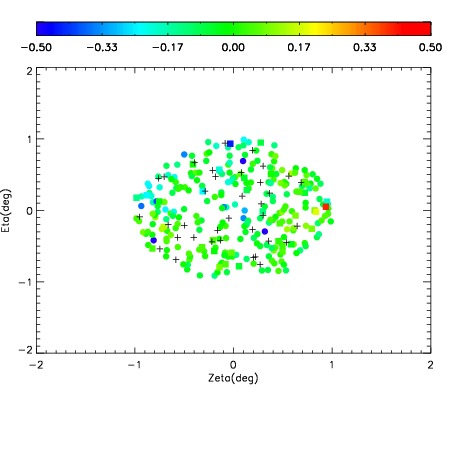
| Spatial mag deviation
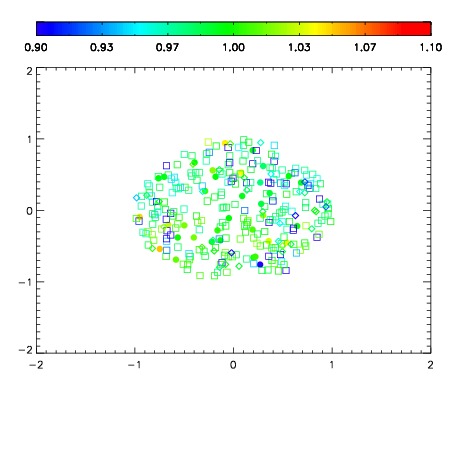
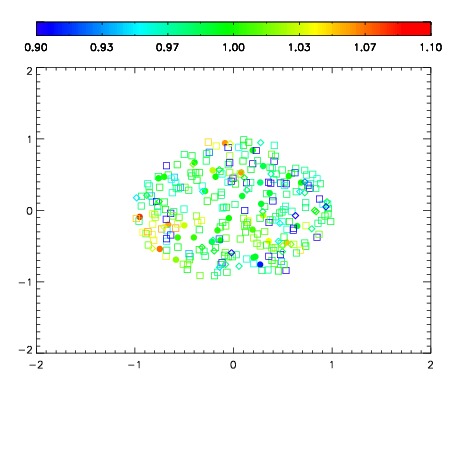
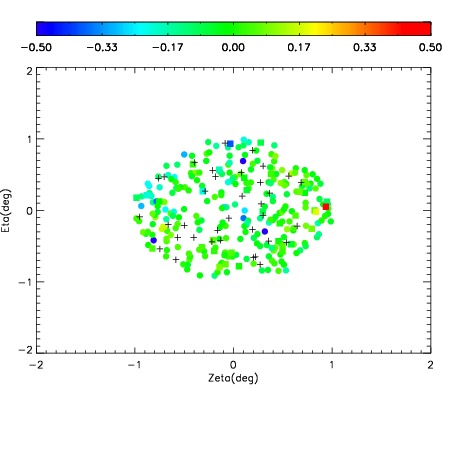
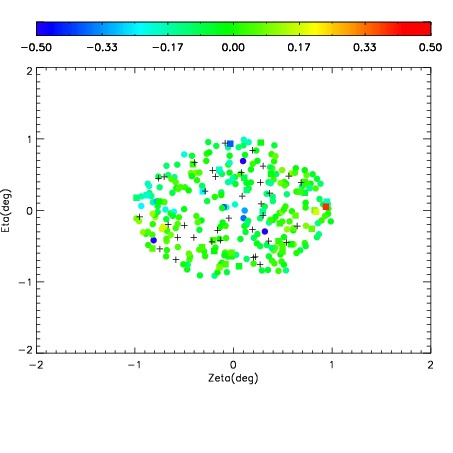
| Spatial sky 16325A emission deviations (filled: sky, open: star)
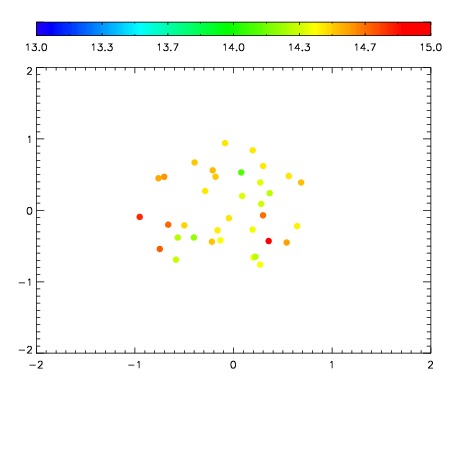
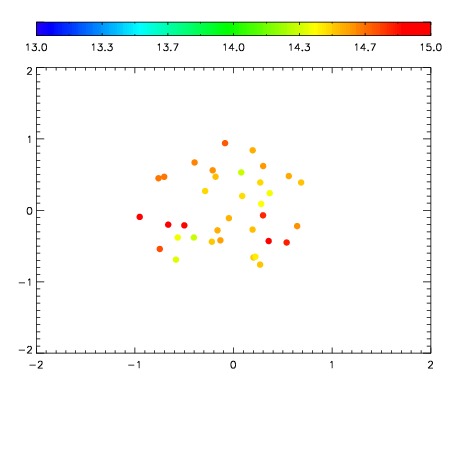
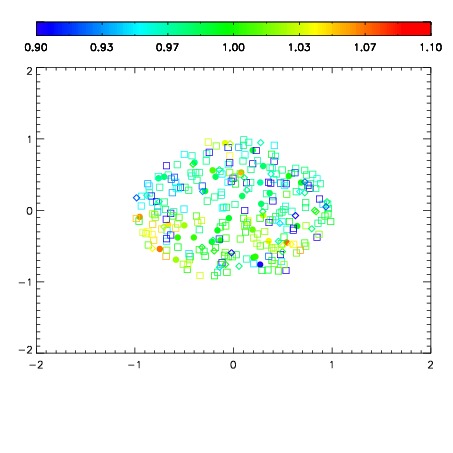
| Spatial sky continuum emission
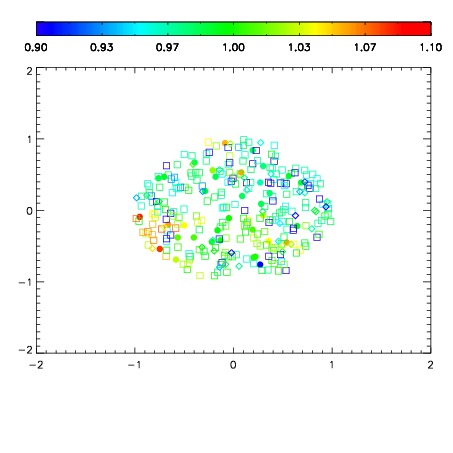
| Spatial sky telluric CO2 absorption deviations (filled: H < 10)
|
| 4750032
| 47
| | Red | Green | Blue
| | z | | 18.78
| | znorm | | 14.60
| | sky | 14.6 | 14.5 | 14.8
| | S/N | 16.4 | 23.4 | 24.2
| | S/N(c) | 15.2 | 22.2 | 23.2
| | SN(E/C) 0.95
|
| 
| 
| 
| 
| 
|
| 4750033
| 47
| | Red | Green | Blue
| | z | | 18.81
| | znorm | | 14.63
| | sky | 14.8 | 14.6 | 15.3
| | S/N | 16.3 | 23.7 | 24.8
| | S/N(c) | 15.1 | 22.5 | 23.4
| | SN(E/C) 0.94
|
| 
| 
| 
| 
| 
|
| 4750034
| 47
| | Red | Green | Blue
| | z | | 18.81
| | znorm | | 14.63
| | sky | 14.6 | 14.6 | 15.3
| | S/N | 16.3 | 23.7 | 24.9
| | S/N(c) | 15.1 | 22.6 | 23.6
| | SN(E/C) 0.94
|
| 
| 
| 
| 
| 
|
| 4750035
| 47
| | Red | Green | Blue
| | z | | 18.79
| | znorm | | 14.61
| | sky | 14.8 | 14.7 | 15.2
| | S/N | 16.1 | 23.2 | 24.5
| | S/N(c) | 14.9 | 22.1 | 23.2
| | SN(E/C) 0.96
|
| 
| 
| 
| 
| 
|

