| Red | Green | Blue | |
| z | 17.64 | ||
| znorm | Inf | ||
| sky | -Inf | -Inf | -Inf |
| S/N | 35.6 | 48.8 | 54.0 |
| S/N(c) | 0.0 | 0.0 | 0.0 |
| SN(E/C) |
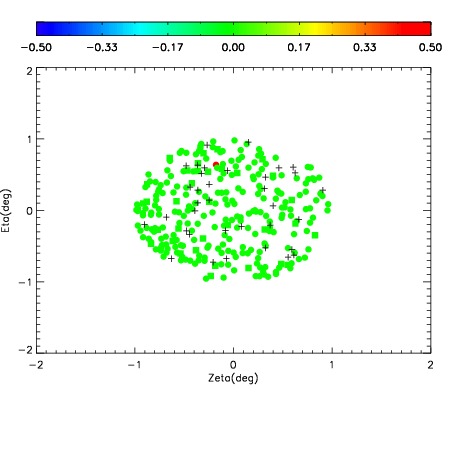
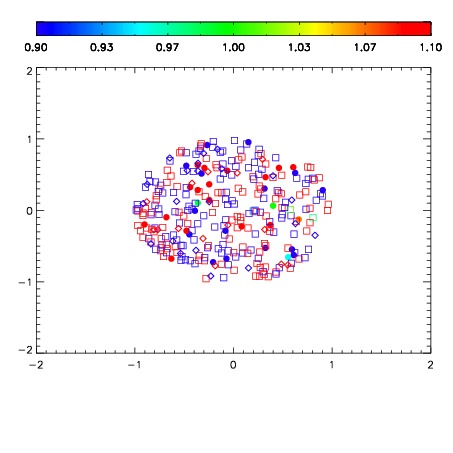
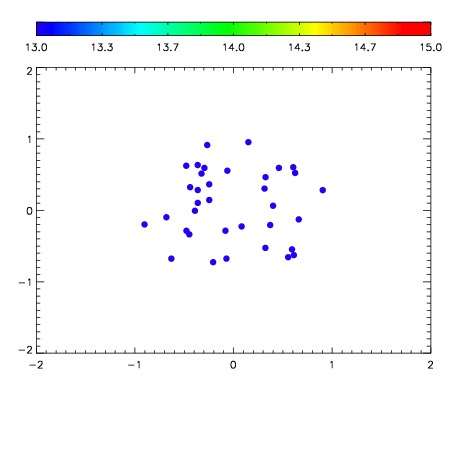

| Frame | Nreads | Zeropoints | Mag plots | Spatial mag deviation | Spatial sky 16325A emission deviations (filled: sky, open: star) | Spatial sky continuum emission | Spatial sky telluric CO2 absorption deviations (filled: H < 10) | |||||||||||||||||||||||
| 0 | 0 |
|
|
|
|
|
|
| IPAIR | NAME | SHIFT | NEWSHIFT | S/N | NAME | SHIFT | NEWSHIFT | S/N |
| 0 | 05230064 | 0.493367 | 0.00000 | 206.632 | 05230062 | 0.00490885 | 0.488458 | 202.952 |
| 1 | 05230059 | 0.489189 | 0.00417799 | 211.581 | 05230058 | 0.00000 | 0.493367 | 209.989 |
| 2 | 05230060 | 0.490622 | 0.00274497 | 207.589 | 05230065 | 0.00731242 | 0.486055 | 205.717 |
| 3 | 05230063 | 0.492874 | 0.000492990 | 201.871 | 05230061 | 0.00422888 | 0.489138 | 195.544 |