| Red | Green | Blue | |
| z | 17.64 | ||
| znorm | Inf | ||
| sky | -NaN | -Inf | -Inf |
| S/N | 32.1 | 45.9 | 47.5 |
| S/N(c) | 0.0 | 0.0 | 0.0 |
| SN(E/C) |

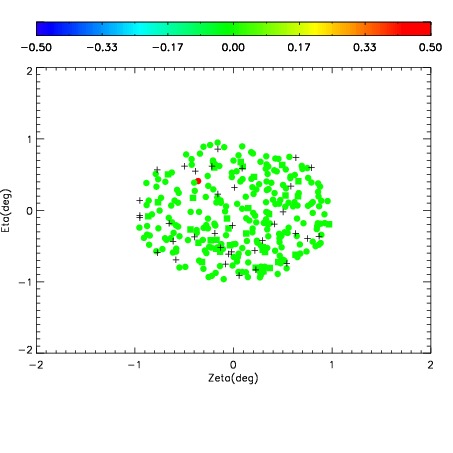

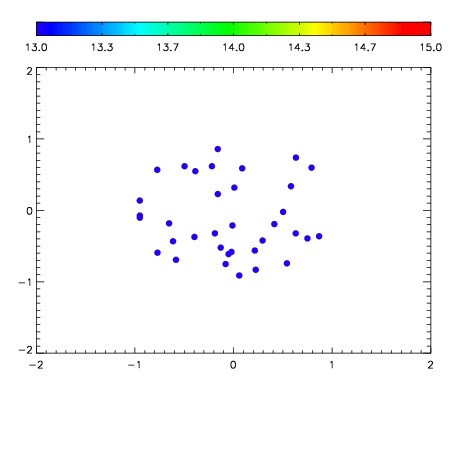

| Frame | Nreads | Zeropoints | Mag plots | Spatial mag deviation | Spatial sky 16325A emission deviations (filled: sky, open: star) | Spatial sky continuum emission | Spatial sky telluric CO2 absorption deviations (filled: H < 10) | |||||||||||||||||||||||
| 0 | 0 |
|
|
|
|
|
|
| IPAIR | NAME | SHIFT | NEWSHIFT | S/N | NAME | SHIFT | NEWSHIFT | S/N |
| 0 | 04790015 | 0.488622 | 0.00000 | 248.218 | 04790010 | 0.00000 | 0.488622 | 244.689 |
| 1 | 04790012 | 0.488437 | 0.000185013 | 249.145 | 04790014 | 0.000869914 | 0.487752 | 248.881 |
| 2 | 04790011 | 0.488059 | 0.000562996 | 248.408 | 04790013 | -0.00568692 | 0.494309 | 248.802 |