| Red | Green | Blue | |
| z | 17.64 | ||
| znorm | Inf | ||
| sky | -NaN | -Inf | -Inf |
| S/N | 23.9 | 42.1 | 48.8 |
| S/N(c) | 0.0 | 0.0 | 0.0 |
| SN(E/C) |
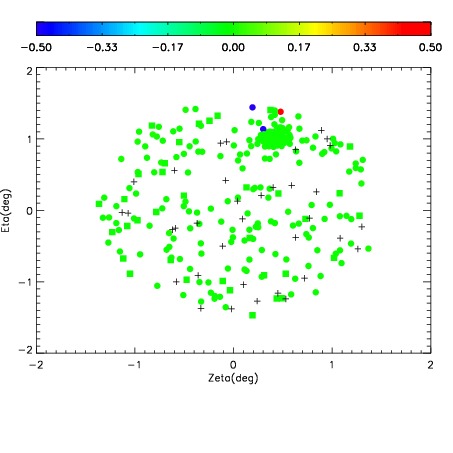

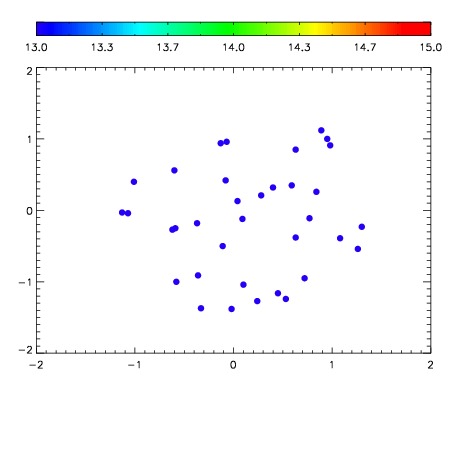

| Frame | Nreads | Zeropoints | Mag plots | Spatial mag deviation | Spatial sky 16325A emission deviations (filled: sky, open: star) | Spatial sky continuum emission | Spatial sky telluric CO2 absorption deviations (filled: H < 10) | |||||||||||||||||||||||
| 0 | 0 |
|
|
|
|
|
|
| IPAIR | NAME | SHIFT | NEWSHIFT | S/N | NAME | SHIFT | NEWSHIFT | S/N |
| 0 | 04910053 | 0.487980 | 0.00000 | 151.642 | 04910047 | 0.00000 | 0.487980 | 145.238 |
| 1 | 04910049 | 0.486185 | 0.00179499 | 168.761 | 04910051 | -0.000395445 | 0.488375 | 170.080 |
| 2 | 04910052 | 0.486122 | 0.00185800 | 167.687 | 04910050 | -8.30223e-05 | 0.488063 | 166.833 |
| 3 | 04910048 | 0.486648 | 0.00133201 | 153.092 | 04910054 | -6.34163e-05 | 0.488043 | 164.269 |