| Red | Green | Blue | |
| z | 17.64 | ||
| znorm | Inf | ||
| sky | -Inf | -NaN | -Inf |
| S/N | 27.2 | 46.3 | 51.8 |
| S/N(c) | 0.0 | 0.0 | 0.0 |
| SN(E/C) |
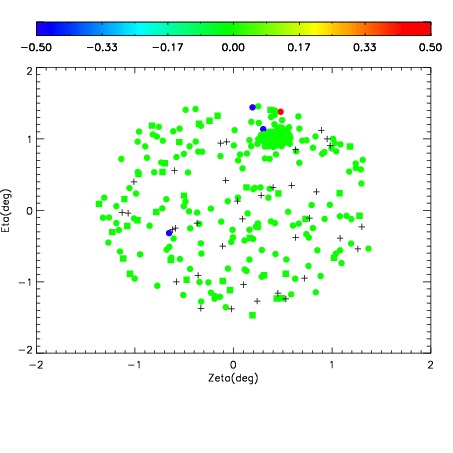
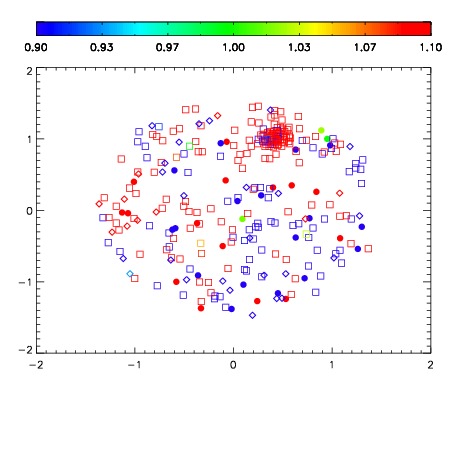
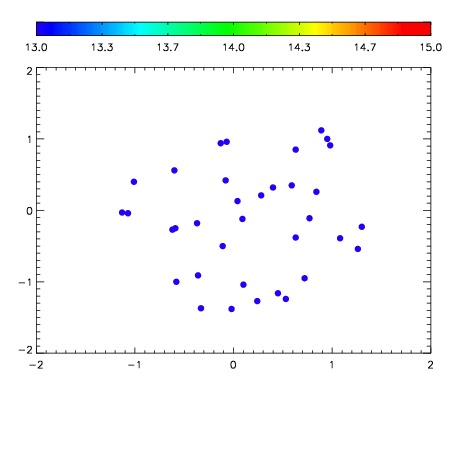

| Frame | Nreads | Zeropoints | Mag plots | Spatial mag deviation | Spatial sky 16325A emission deviations (filled: sky, open: star) | Spatial sky continuum emission | Spatial sky telluric CO2 absorption deviations (filled: H < 10) | |||||||||||||||||||||||
| 0 | 0 |
|
|
|
|
|
|
| IPAIR | NAME | SHIFT | NEWSHIFT | S/N | NAME | SHIFT | NEWSHIFT | S/N |
| 0 | 05440012 | 0.480290 | 0.00000 | 162.598 | 05440011 | 0.00000 | 0.480290 | 159.728 |
| 1 | 05440017 | 0.479989 | 0.000301003 | 172.432 | 05440018 | -0.00354164 | 0.483832 | 172.079 |
| 2 | 05440016 | 0.478817 | 0.00147301 | 170.824 | 05440015 | -0.00481354 | 0.485104 | 167.915 |
| 3 | 05440013 | 0.479941 | 0.000348985 | 163.179 | 05440014 | -0.00471434 | 0.485004 | 166.523 |