| Red | Green | Blue | |
| z | 17.64 | ||
| znorm | Inf | ||
| sky | -Inf | -Inf | -Inf |
| S/N | 23.1 | 39.8 | 42.3 |
| S/N(c) | 0.0 | 0.0 | 0.0 |
| SN(E/C) |
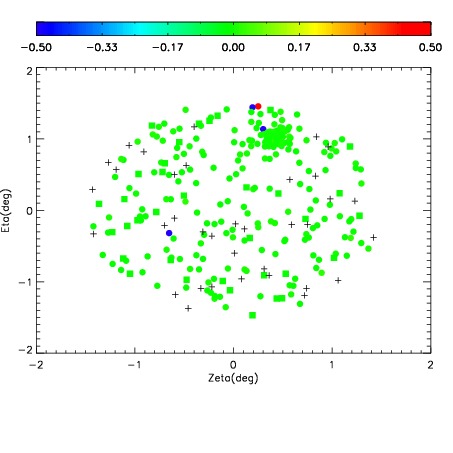
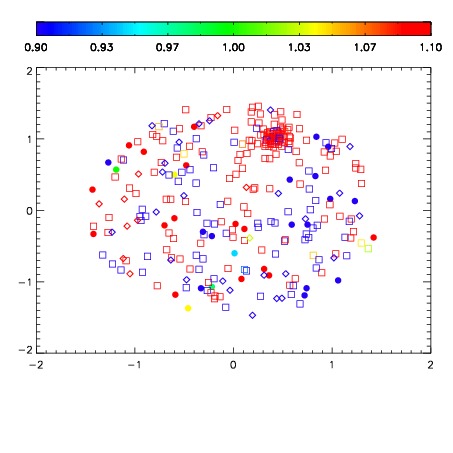
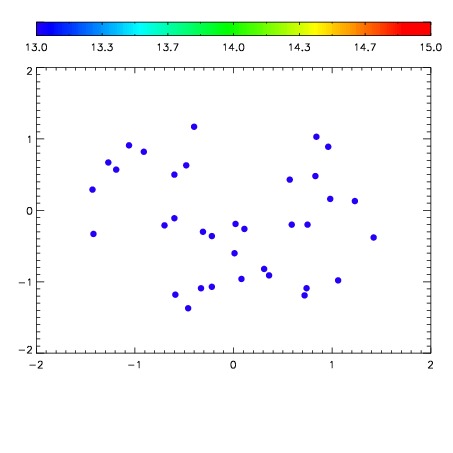

| Frame | Nreads | Zeropoints | Mag plots | Spatial mag deviation | Spatial sky 16325A emission deviations (filled: sky, open: star) | Spatial sky continuum emission | Spatial sky telluric CO2 absorption deviations (filled: H < 10) | |||||||||||||||||||||||
| 0 | 0 |
|
|
|
|
|
|
| IPAIR | NAME | SHIFT | NEWSHIFT | S/N | NAME | SHIFT | NEWSHIFT | S/N |
| 0 | 04920053 | 0.495930 | 0.00000 | 200.967 | 04920051 | 0.00502806 | 0.490902 | 183.168 |
| 1 | 04920049 | 0.493871 | 0.00205898 | 220.908 | 04920047 | 0.00000 | 0.495930 | 217.510 |
| 2 | 04920048 | 0.492152 | 0.00377798 | 219.526 | 04920050 | 0.00549139 | 0.490439 | 215.820 |
| 3 | 04920052 | 0.493970 | 0.00195998 | 185.441 | 04920054 | 0.00504603 | 0.490884 | 141.734 |