| Red | Green | Blue | |
| z | 17.65 | ||
| znorm | Inf | ||
| sky | -Inf | -Inf | -Inf |
| S/N | 20.1 | 36.6 | 37.4 |
| S/N(c) | 0.0 | 0.0 | 0.0 |
| SN(E/C) |
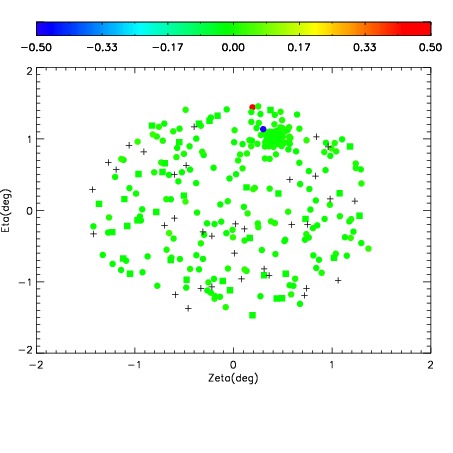
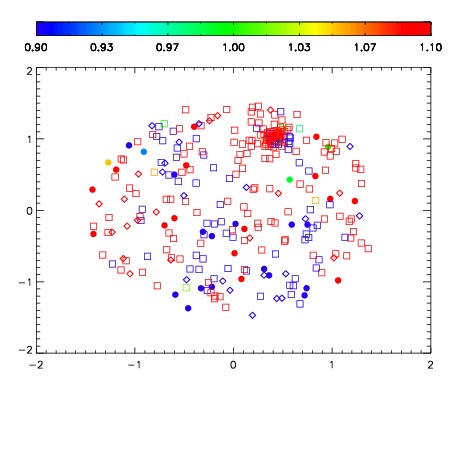
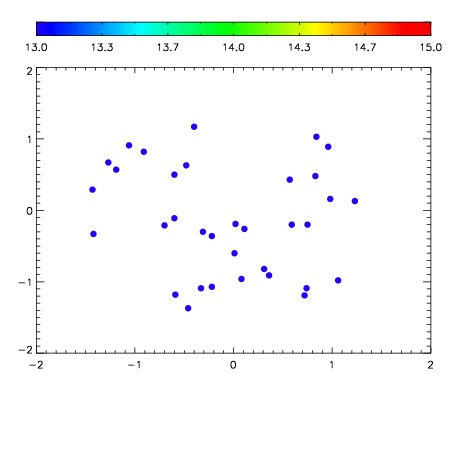

| Frame | Nreads | Zeropoints | Mag plots | Spatial mag deviation | Spatial sky 16325A emission deviations (filled: sky, open: star) | Spatial sky continuum emission | Spatial sky telluric CO2 absorption deviations (filled: H < 10) | |||||||||||||||||||||||
| 0 | 0 |
|
|
|
|
|
|
| IPAIR | NAME | SHIFT | NEWSHIFT | S/N | NAME | SHIFT | NEWSHIFT | S/N |
| 0 | 05470010 | 0.492644 | 0.00000 | 183.469 | 05470011 | -0.00149972 | 0.494144 | 187.425 |
| 1 | 05470009 | 0.491771 | 0.000872999 | 181.037 | 05470008 | 0.00000 | 0.492644 | 185.324 |
| 2 | 05470014 | 0.488942 | 0.00370201 | 171.885 | 05470015 | -0.00261186 | 0.495256 | 182.538 |
| 3 | 05470013 | 0.488374 | 0.00427002 | 166.751 | 05470012 | -0.00362420 | 0.496268 | 148.917 |