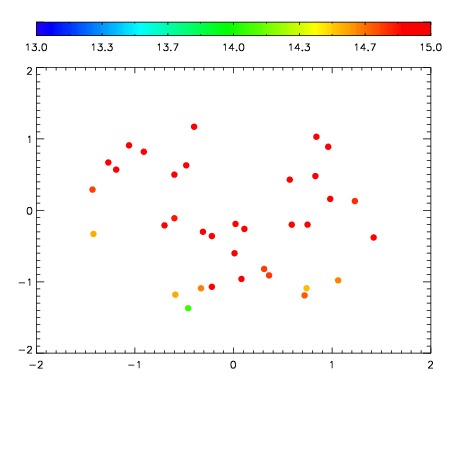
| Frame | Nreads | Zeropoints | Mag plots
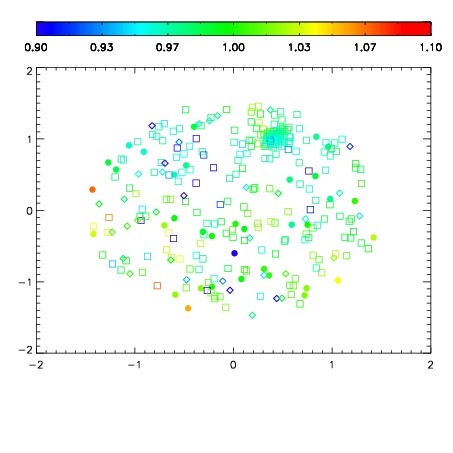
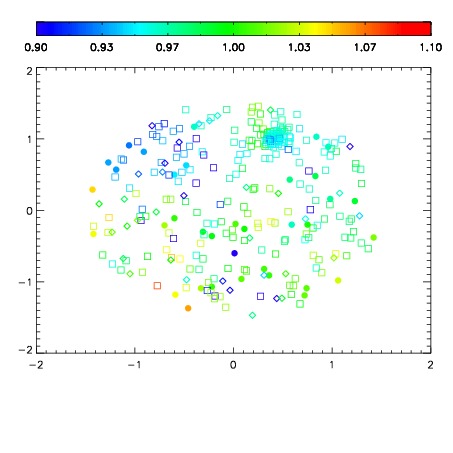
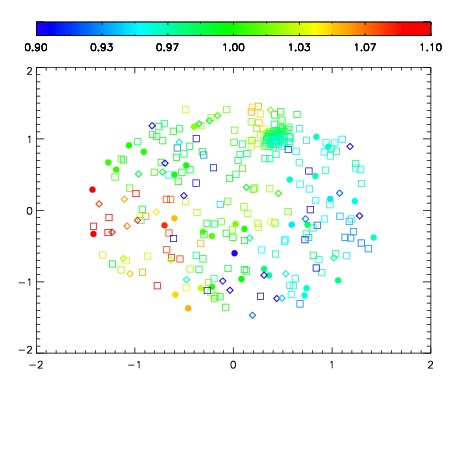
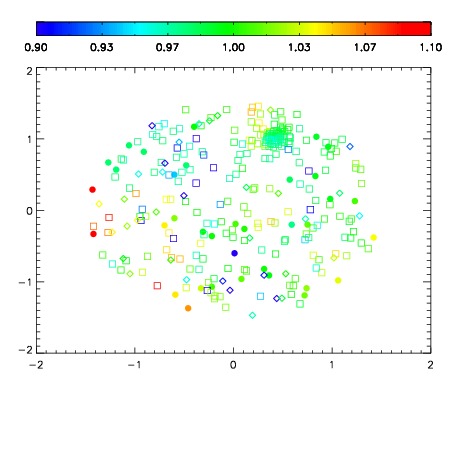
| Spatial mag deviation
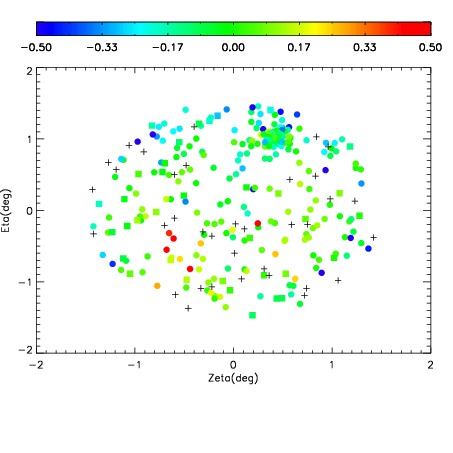
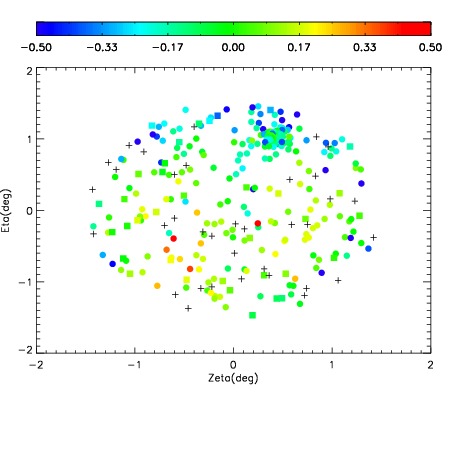
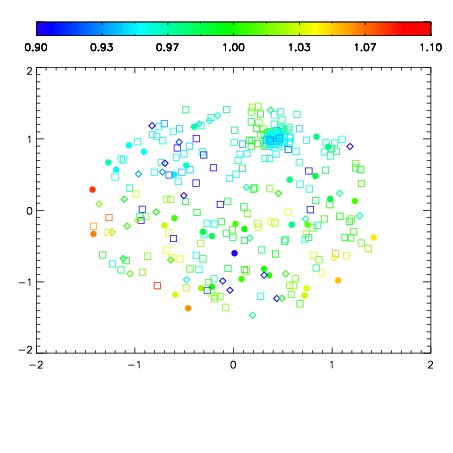
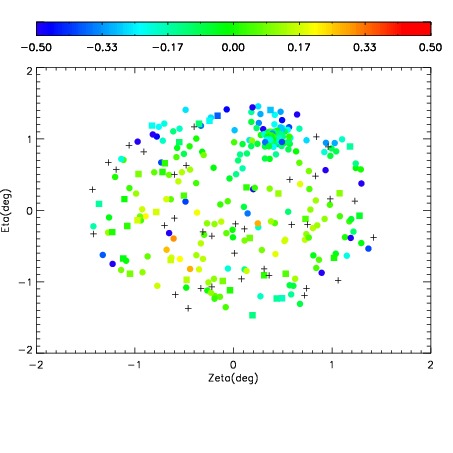
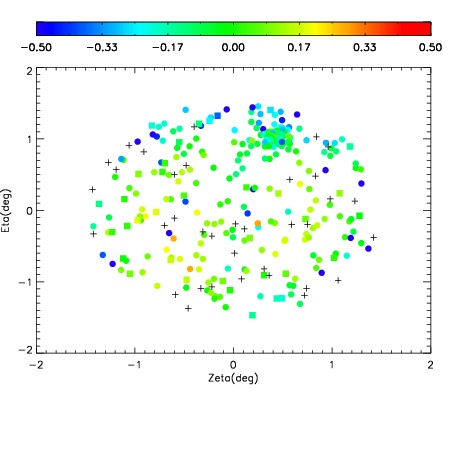
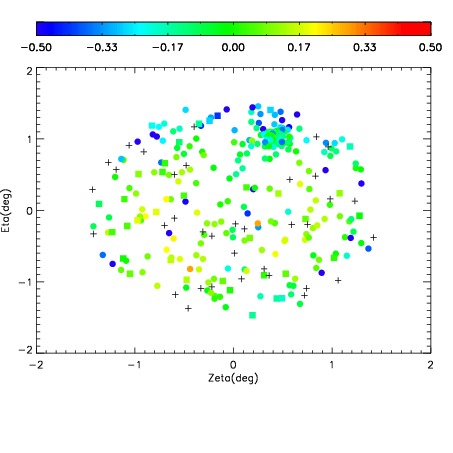
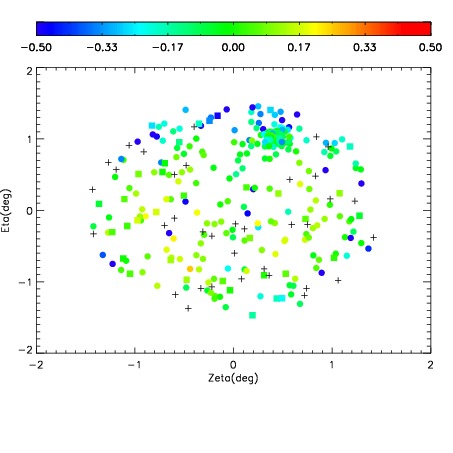
| Spatial sky 16325A emission deviations (filled: sky, open: star)
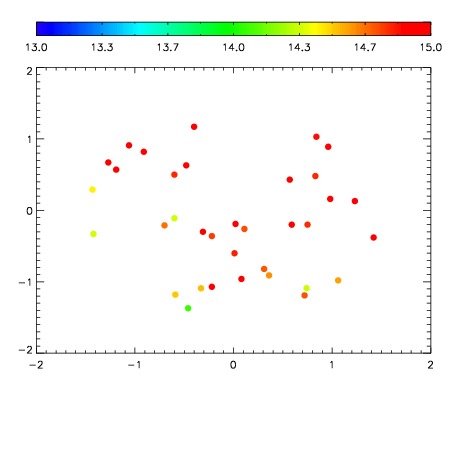
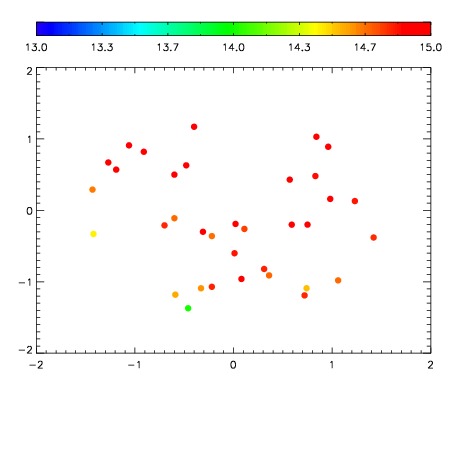
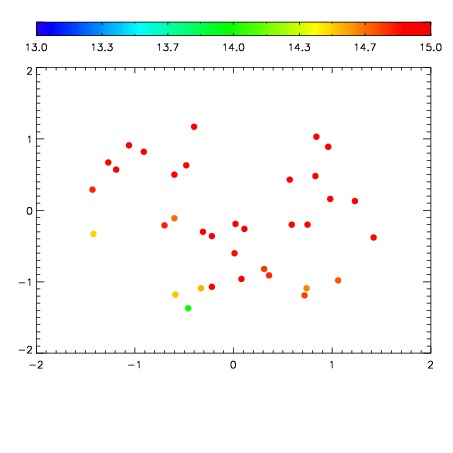
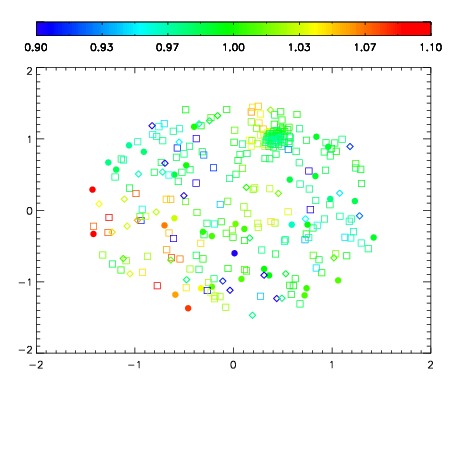
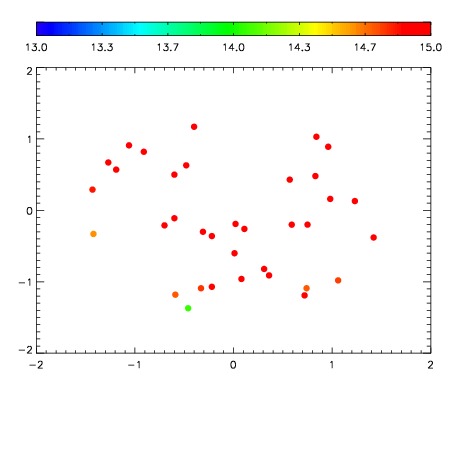
| Spatial sky continuum emission
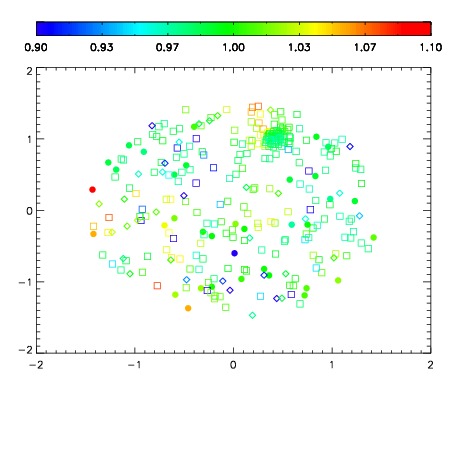
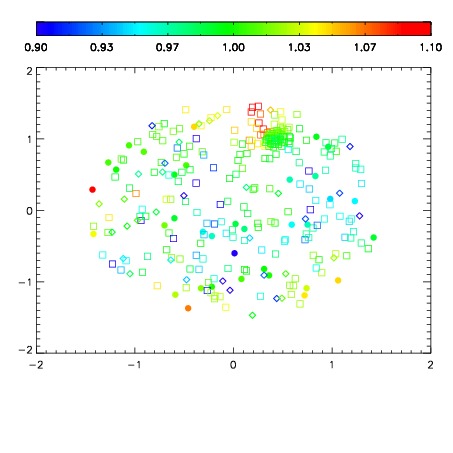
| Spatial sky telluric CO2 absorption deviations (filled: H < 10)
|
| 7830093
| 47
| | Red | Green | Blue
| | z | | 18.27
| | znorm | | 14.09
| | sky | 15.4 | 14.8 | 14.4
| | S/N | 9.7 | 17.7 | 17.3
| | S/N(c) | 8.1 | 15.9 | 17.4
| | SN(E/C) 0.50
|
| 
| 
| 
| 
| 
|
| 7830094
| 47
| | Red | Green | Blue
| | z | | 18.51
| | znorm | | 14.33
| | sky | 15.3 | 14.8 | 15.1
| | S/N | 11.9 | 20.8 | 21.4
| | S/N(c) | 10.1 | 18.8 | 19.9
| | SN(E/C) 0.43
|
| 
| 
| 
| 
| 
|
| 7830095
| 47
| | Red | Green | Blue
| | z | | 18.63
| | znorm | | 14.45
| | sky | 15.2 | 14.8 | 14.9
| | S/N | 12.1 | 21.4 | 21.9
| | S/N(c) | 10.4 | 19.6 | 20.5
| | SN(E/C) 0.33
|
| 
| 
| 
| 
| 
|
| 7830096
| 47
| | Red | Green | Blue
| | z | | 18.59
| | znorm | | 14.41
| | sky | 15.3 | 14.9 | 14.8
| | S/N | 12.5 | 21.8 | 22.1
| | S/N(c) | 10.6 | 19.8 | 20.8
| | SN(E/C) 0.42
|
| 
| 
| 
| 
| 
|
| 7830097
| 47
| | Red | Green | Blue
| | z | | 18.75
| | znorm | | 14.57
| | sky | 15.1 | 14.9 | 14.8
| | S/N | 13.5 | 23.3 | 23.9
| | S/N(c) | 11.5 | 21.2 | 22.5
| | SN(E/C) 0.40
|
| 
| 
| 
| 
| 
|
| 7830098
| 47
| | Red | Green | Blue
| | z | | 18.76
| | znorm | | 14.58
| | sky | 15.2 | 14.9 | 14.7
| | S/N | 13.6 | 23.8 | 23.9
| | S/N(c) | 11.5 | 21.6 | 22.8
| | SN(E/C) 0.38
|
| 
| 
| 
| 
| 
|
| 7830099
| 47
| | Red | Green | Blue
| | z | | 18.76
| | znorm | | 14.58
| | sky | 15.1 | 14.9 | 14.7
| | S/N | 13.6 | 23.7 | 23.9
| | S/N(c) | 11.6 | 21.7 | 22.4
| | SN(E/C) 0.39
|
| 
| 
| 
| 
| 
|
| 7830100
| 47
| | Red | Green | Blue
| | z | | 18.84
| | znorm | | 14.66
| | sky | 15.6 | 15.1 | 14.6
| | S/N | 14.7 | 25.2 | 25.2
| | S/N(c) | 12.5 | 22.8 | 23.8
| | SN(E/C) 0.40
|
| 
| 
| 
| 
| 
|