| Red | Green | Blue | |
| z | 17.64 | ||
| znorm | Inf | ||
| sky | -Inf | -Inf | -Inf |
| S/N | 21.6 | 40.4 | 42.4 |
| S/N(c) | 0.0 | 0.0 | 0.0 |
| SN(E/C) |
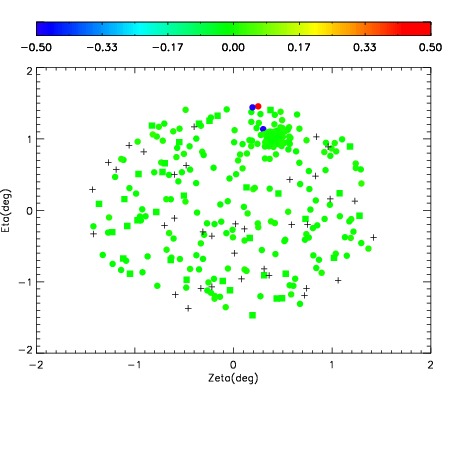
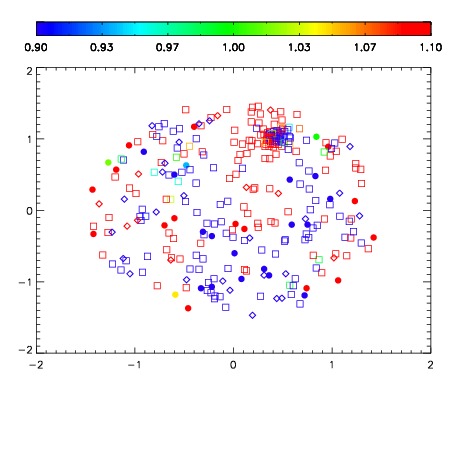


| Frame | Nreads | Zeropoints | Mag plots | Spatial mag deviation | Spatial sky 16325A emission deviations (filled: sky, open: star) | Spatial sky continuum emission | Spatial sky telluric CO2 absorption deviations (filled: H < 10) | |||||||||||||||||||||||
| 0 | 0 |
|
|
|
|
|
|
| IPAIR | NAME | SHIFT | NEWSHIFT | S/N | NAME | SHIFT | NEWSHIFT | S/N |
| 0 | 07830099 | 0.471261 | 0.00000 | 199.549 | 07830097 | -0.00527223 | 0.476533 | 198.009 |
| 1 | 07830098 | 0.470974 | 0.000286996 | 200.594 | 07830100 | -0.00529358 | 0.476555 | 206.232 |
| 2 | 07830095 | 0.471056 | 0.000204980 | 186.709 | 07830096 | 0.000531576 | 0.470729 | 185.094 |
| 3 | 07830094 | 0.471062 | 0.000198990 | 179.644 | 07830093 | 0.00000 | 0.471261 | 154.523 |