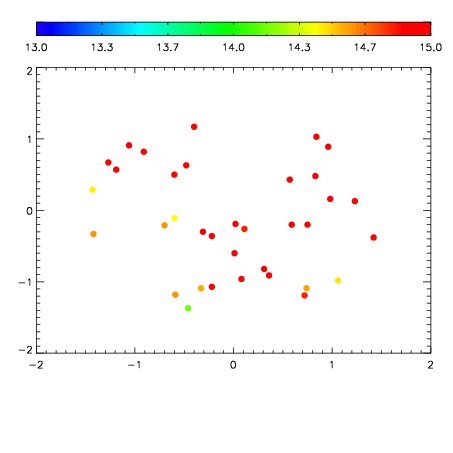
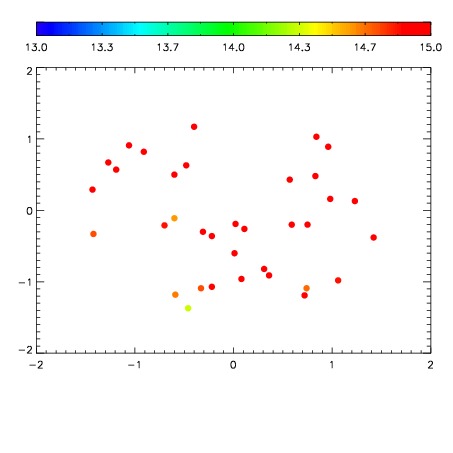
| Frame | Nreads | Zeropoints | Mag plots
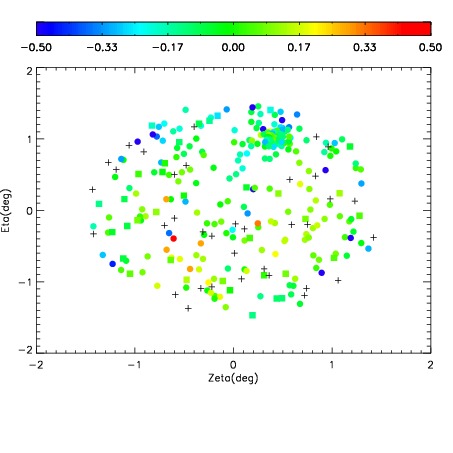
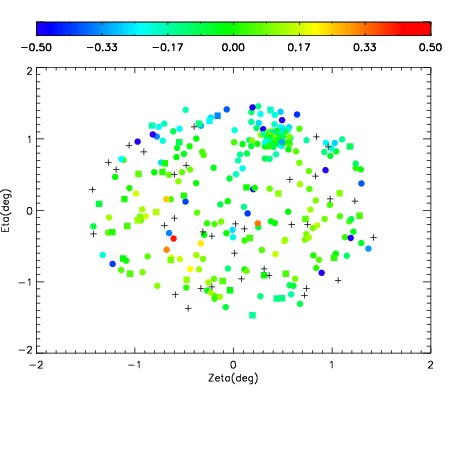
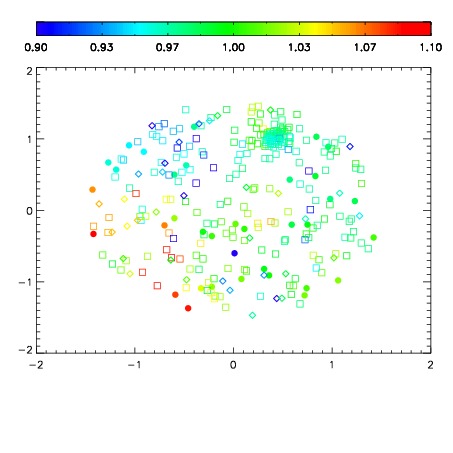
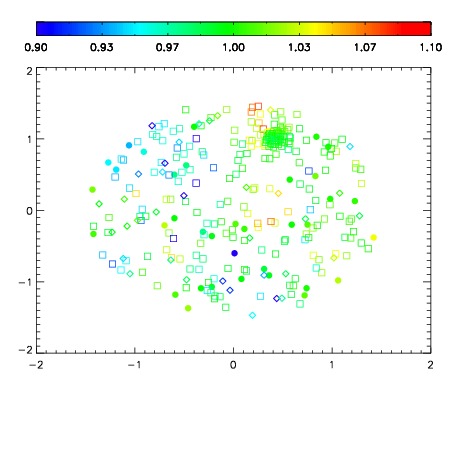
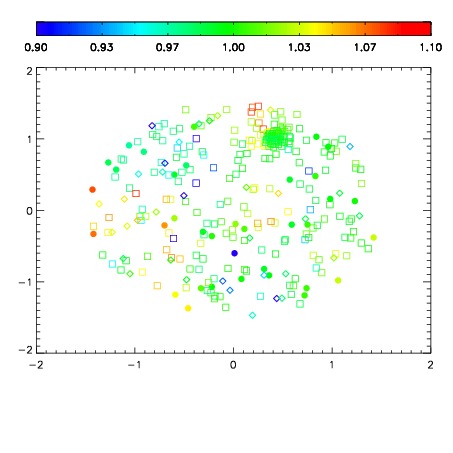
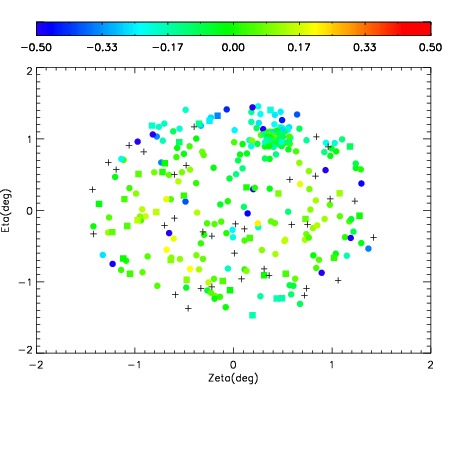
| Spatial mag deviation
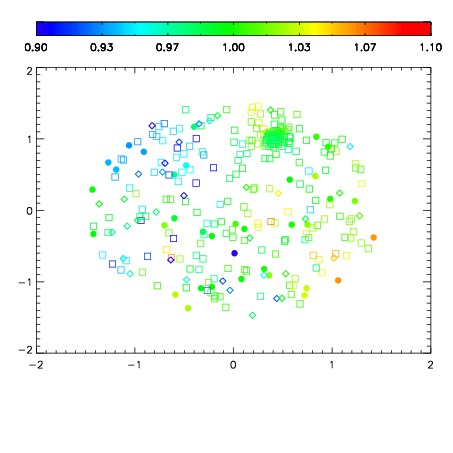
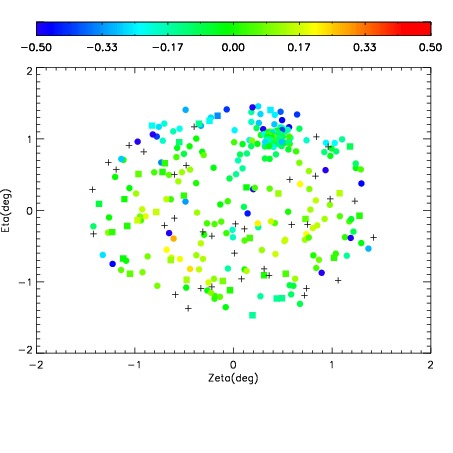
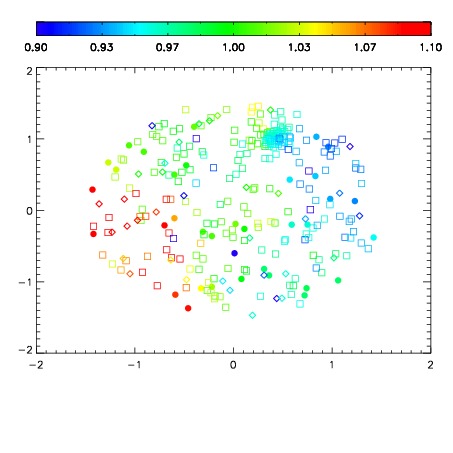
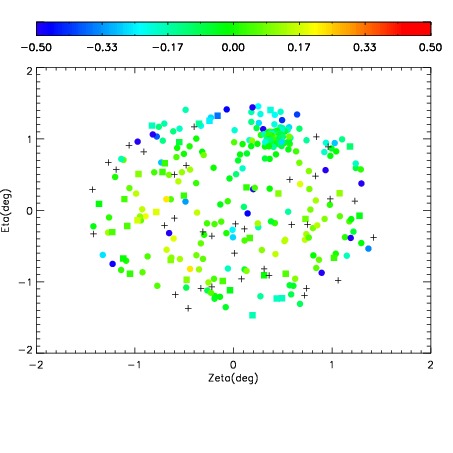
| Spatial sky 16325A emission deviations (filled: sky, open: star)
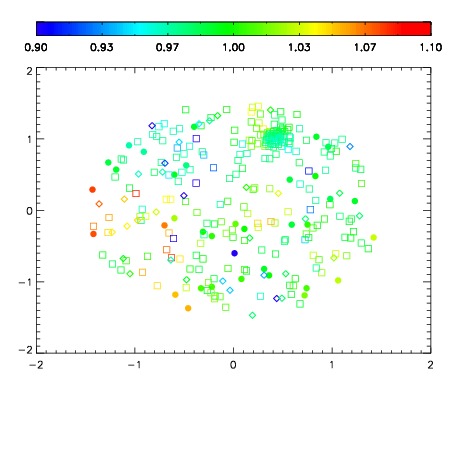
| Spatial sky continuum emission
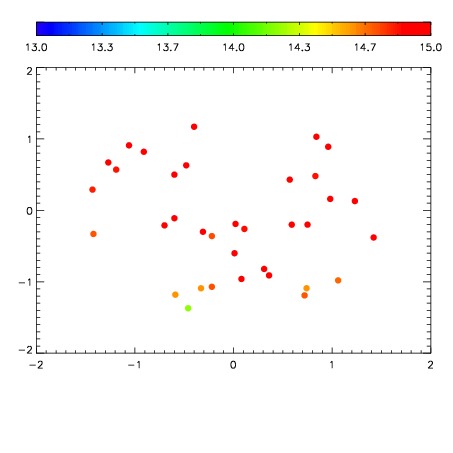
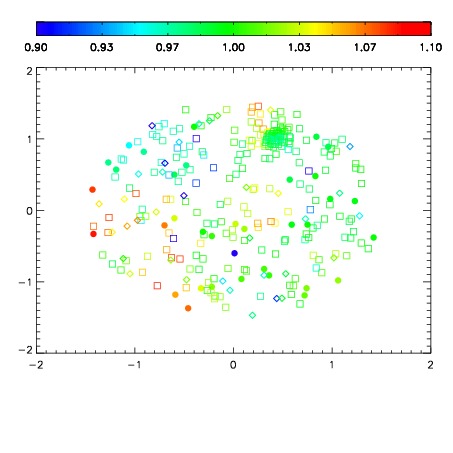
| Spatial sky telluric CO2 absorption deviations (filled: H < 10)
|
| 7840071
| 47
| | Red | Green | Blue
| | z | | 18.31
| | znorm | | 14.13
| | sky | 15.9 | 15.0 | 14.4
| | S/N | 10.0 | 17.7 | 17.7
| | S/N(c) | 8.4 | 16.2 | 17.7
| | SN(E/C) 0.32
|
| 
| 
| 
| 
| 
|
| 7840072
| 47
| | Red | Green | Blue
| | z | | 18.25
| | znorm | | 14.07
| | sky | 15.9 | 15.1 | 14.7
| | S/N | 9.5 | 17.2 | 17.6
| | S/N(c) | 8.1 | 15.6 | 16.9
| | SN(E/C) 0.43
|
| 
| 
| 
| 
| 
|
| 7840073
| 47
| | Red | Green | Blue
| | z | | 18.55
| | znorm | | 14.37
| | sky | 15.2 | 14.9 | 14.9
| | S/N | 11.4 | 20.5 | 20.7
| | S/N(c) | 9.7 | 18.7 | 19.3
| | SN(E/C) 0.40
|
| 
| 
| 
| 
| 
|
| 7840074
| 47
| | Red | Green | Blue
| | z | | 18.45
| | znorm | | 14.27
| | sky | 15.4 | 15.1 | 15.1
| | S/N | 11.3 | 19.6 | 20.1
| | S/N(c) | 9.6 | 17.8 | 18.5
| | SN(E/C) 0.43
|
| 
| 
| 
| 
| 
|
| 7840075
| 47
| | Red | Green | Blue
| | z | | 18.51
| | znorm | | 14.33
| | sky | 15.0 | 14.8 | 14.8
| | S/N | 11.5 | 20.4 | 20.6
| | S/N(c) | 9.8 | 18.5 | 19.3
| | SN(E/C) 0.41
|
| 
| 
| 
| 
| 
|
| 7840076
| 47
| | Red | Green | Blue
| | z | | 18.44
| | znorm | | 14.26
| | sky | 14.9 | 14.9 | 14.9
| | S/N | 10.7 | 19.6 | 19.6
| | S/N(c) | 9.1 | 17.8 | 18.3
| | SN(E/C) 0.44
|
| 
| 
| 
| 
| 
|
| 7840077
| 47
| | Red | Green | Blue
| | z | | 18.48
| | znorm | | 14.30
| | sky | 15.4 | 15.0 | 14.9
| | S/N | 11.5 | 20.4 | 20.3
| | S/N(c) | 9.9 | 18.5 | 19.2
| | SN(E/C) 0.44
|
| 
| 
| 
| 
| 
|
| 7840078
| 47
| | Red | Green | Blue
| | z | | 18.46
| | znorm | | 14.28
| | sky | 15.3 | 15.1 | 15.1
| | S/N | 11.3 | 20.0 | 20.3
| | S/N(c) | 9.5 | 18.0 | 18.8
| | SN(E/C) 0.48
|
| 
| 
| 
| 
| 
|