| Red | Green | Blue | |
| z | 17.65 | ||
| znorm | Inf | ||
| sky | -Inf | -Inf | -Inf |
| S/N | 18.5 | 35.2 | 36.5 |
| S/N(c) | 0.0 | 0.0 | 0.0 |
| SN(E/C) |
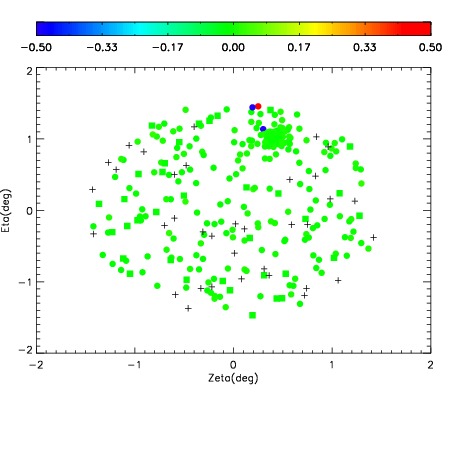
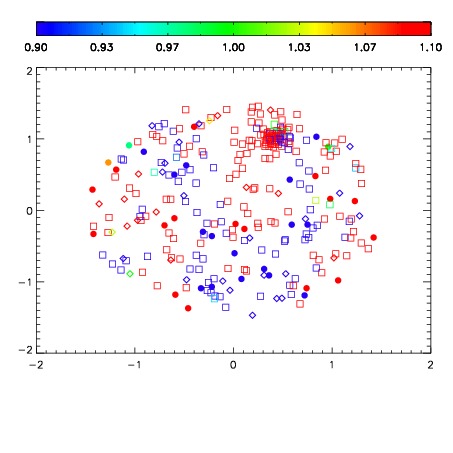
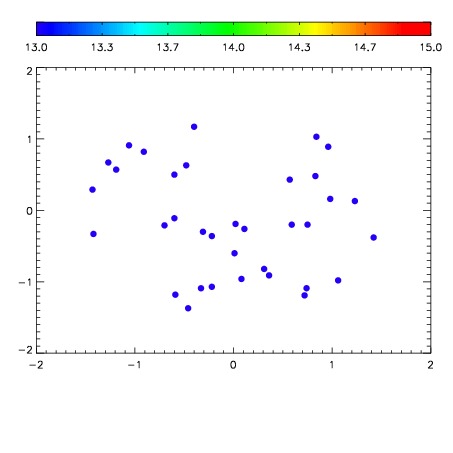

| Frame | Nreads | Zeropoints | Mag plots | Spatial mag deviation | Spatial sky 16325A emission deviations (filled: sky, open: star) | Spatial sky continuum emission | Spatial sky telluric CO2 absorption deviations (filled: H < 10) | |||||||||||||||||||||||
| 0 | 0 |
|
|
|
|
|
|
| IPAIR | NAME | SHIFT | NEWSHIFT | S/N | NAME | SHIFT | NEWSHIFT | S/N |
| 0 | 07840073 | 0.475601 | 0.00000 | 179.758 | 07840075 | -0.00296975 | 0.478571 | 176.604 |
| 1 | 07840077 | 0.475171 | 0.000429988 | 174.481 | 07840078 | -0.00179881 | 0.477400 | 172.468 |
| 2 | 07840076 | 0.473330 | 0.00227100 | 170.648 | 07840074 | -0.00194321 | 0.477544 | 171.930 |
| 3 | 07840072 | 0.475204 | 0.000396997 | 155.048 | 07840071 | 0.00000 | 0.475601 | 156.969 |