| Red | Green | Blue | |
| z | 17.64 | ||
| znorm | Inf | ||
| sky | -Inf | -Inf | -Inf |
| S/N | 24.7 | 44.8 | 49.8 |
| S/N(c) | 0.0 | 0.0 | 0.0 |
| SN(E/C) |
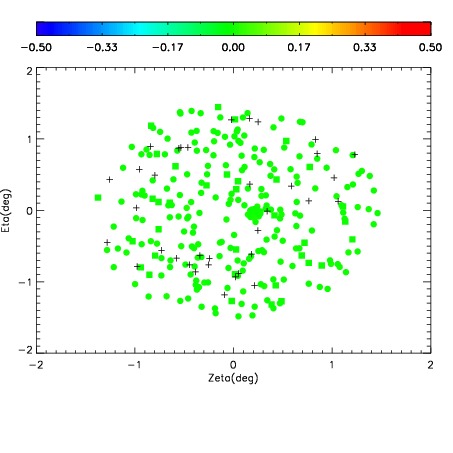
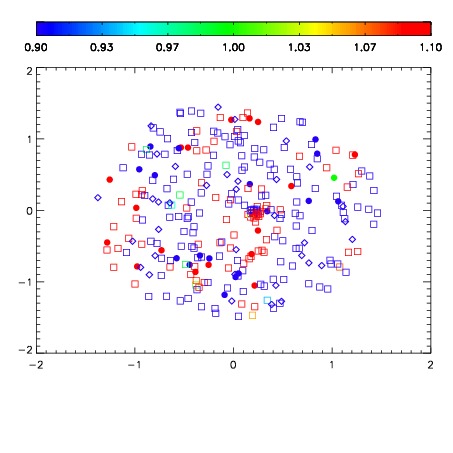


| Frame | Nreads | Zeropoints | Mag plots | Spatial mag deviation | Spatial sky 16325A emission deviations (filled: sky, open: star) | Spatial sky continuum emission | Spatial sky telluric CO2 absorption deviations (filled: H < 10) | |||||||||||||||||||||||
| 0 | 0 |
|
|
|
|
|
|
| IPAIR | NAME | SHIFT | NEWSHIFT | S/N | NAME | SHIFT | NEWSHIFT | S/N |
| 0 | 04650049 | 0.495704 | 0.00000 | 216.250 | 04650050 | 0.000250843 | 0.495453 | 216.451 |
| 1 | 04650052 | 0.492891 | 0.00281298 | 219.479 | 04650051 | -0.00766129 | 0.503365 | 219.691 |
| 2 | 04650053 | 0.495153 | 0.000550985 | 214.878 | 04650054 | 0.00371318 | 0.491991 | 216.268 |
| 3 | 04650048 | 0.494558 | 0.00114599 | 213.583 | 04650047 | 0.00000 | 0.495704 | 213.027 |