| Red | Green | Blue | |
| z | 17.64 | ||
| znorm | Inf | ||
| sky | -Inf | -Inf | -Inf |
| S/N | 25.1 | 45.0 | 48.5 |
| S/N(c) | 0.0 | 0.0 | 0.0 |
| SN(E/C) |
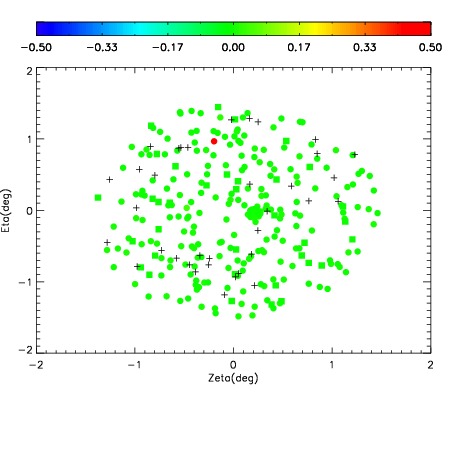
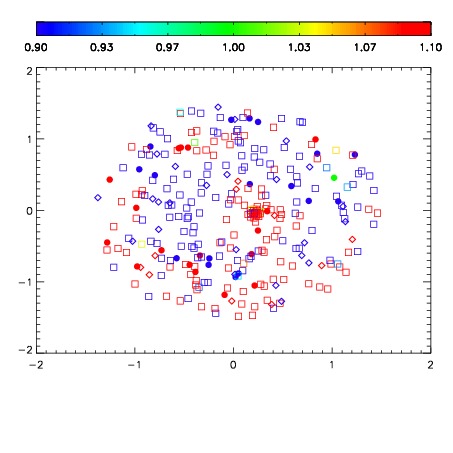
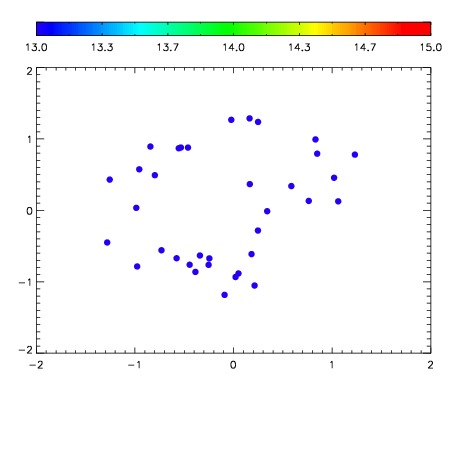

| Frame | Nreads | Zeropoints | Mag plots | Spatial mag deviation | Spatial sky 16325A emission deviations (filled: sky, open: star) | Spatial sky continuum emission | Spatial sky telluric CO2 absorption deviations (filled: H < 10) | |||||||||||||||||||||||
| 0 | 0 |
|
|
|
|
|
|
| IPAIR | NAME | SHIFT | NEWSHIFT | S/N | NAME | SHIFT | NEWSHIFT | S/N |
| 0 | 07890100 | 0.467559 | 0.00000 | 189.993 | 07890098 | -0.000462224 | 0.468021 | 188.408 |
| 1 | 07890099 | 0.467042 | 0.000517011 | 189.236 | 07890101 | 0.000830916 | 0.466728 | 187.278 |
| 2 | 07890096 | 0.467416 | 0.000143021 | 181.829 | 07890097 | -5.30280e-05 | 0.467612 | 181.546 |
| 3 | 07890095 | 0.467104 | 0.000455022 | 178.460 | 07890094 | 0.00000 | 0.467559 | 169.194 |