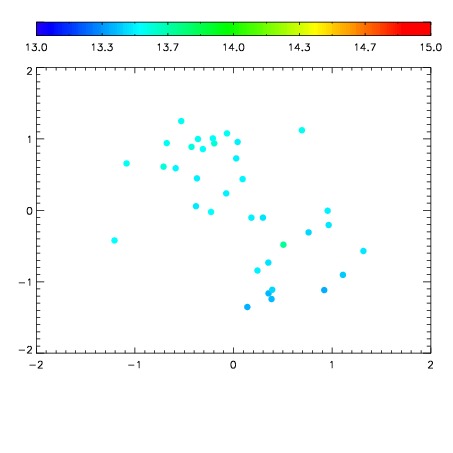
| Frame | Nreads | Zeropoints | Mag plots
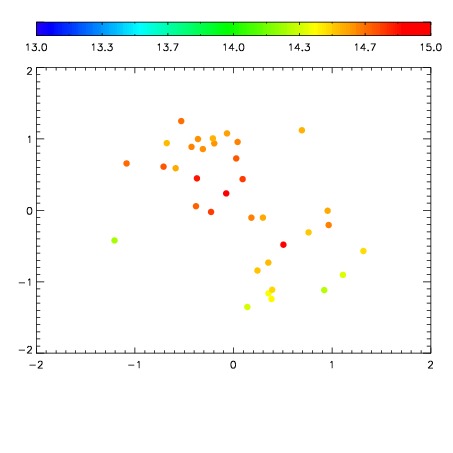
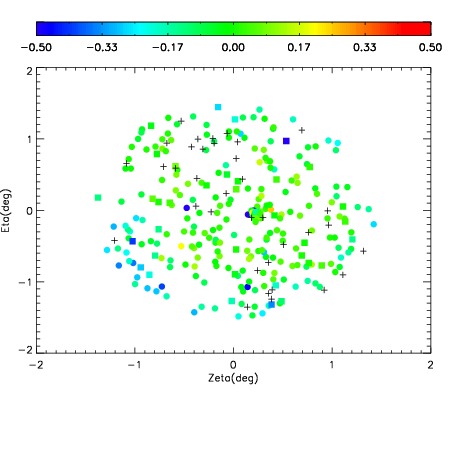
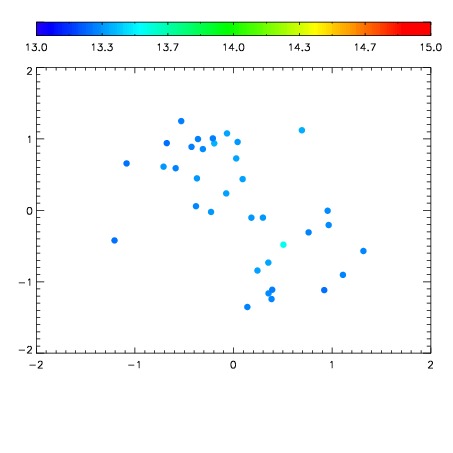
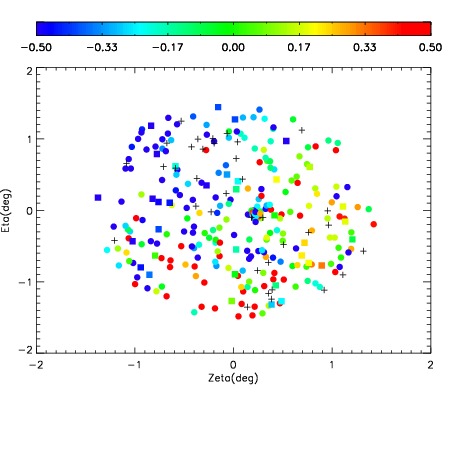
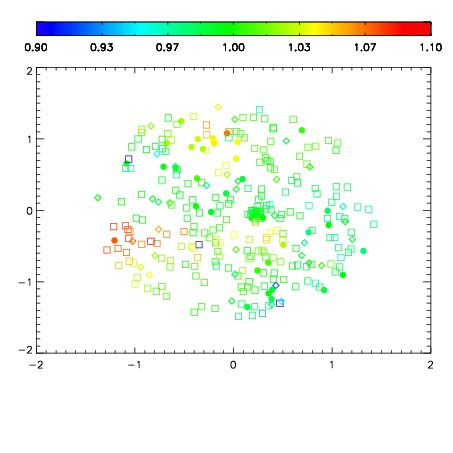
| Spatial mag deviation
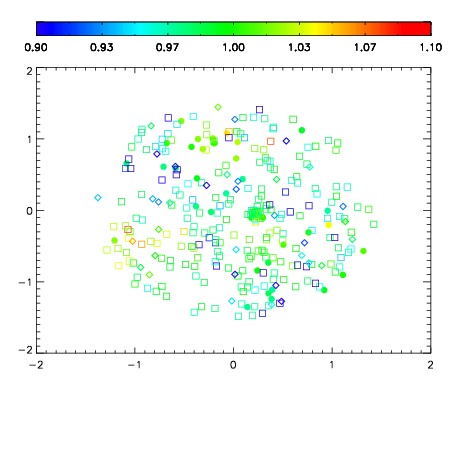
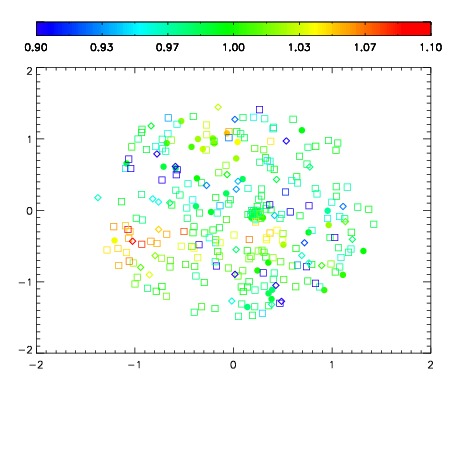
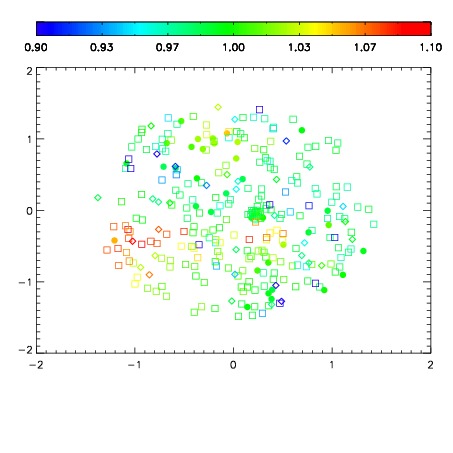
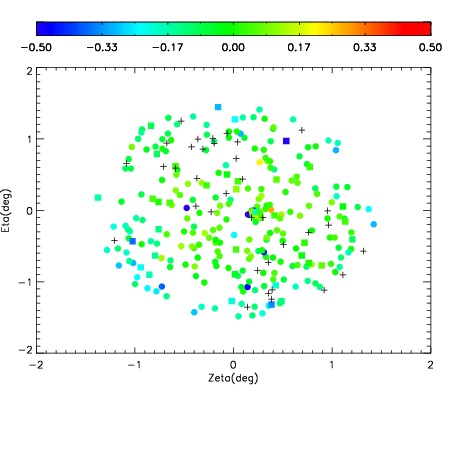
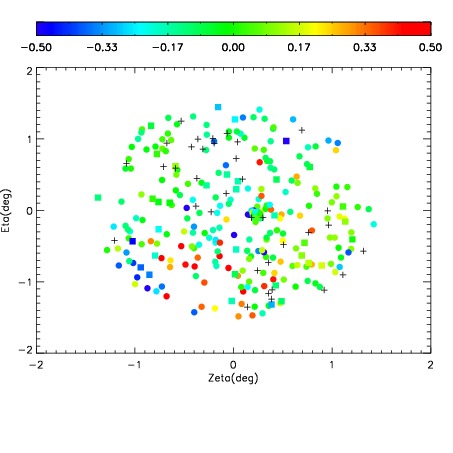
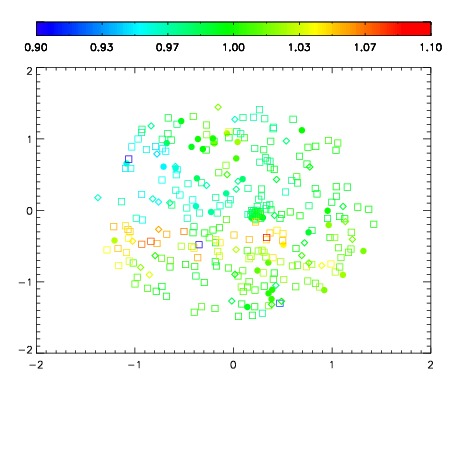
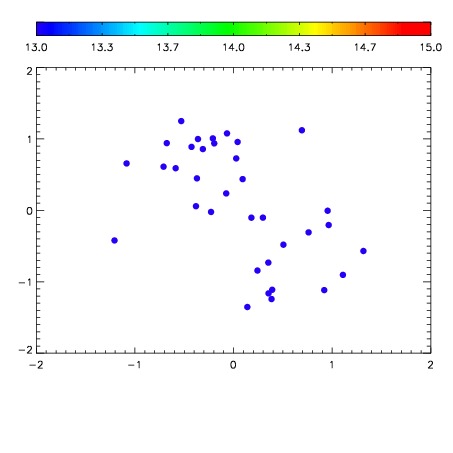
| Spatial sky 16325A emission deviations (filled: sky, open: star)
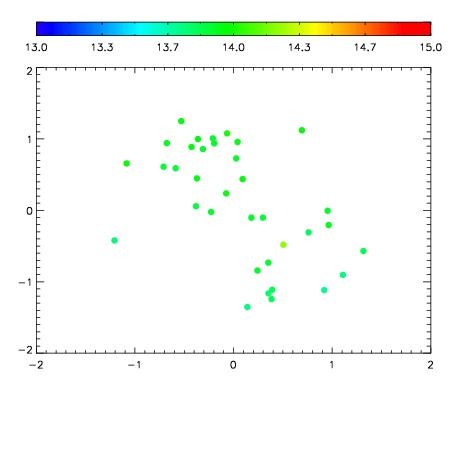
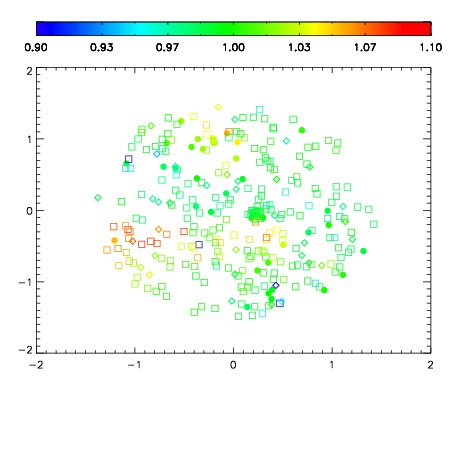
| Spatial sky continuum emission
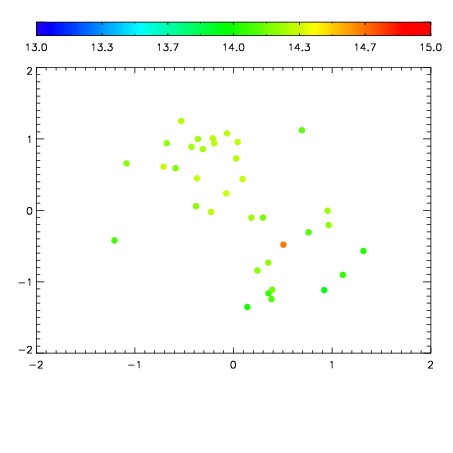
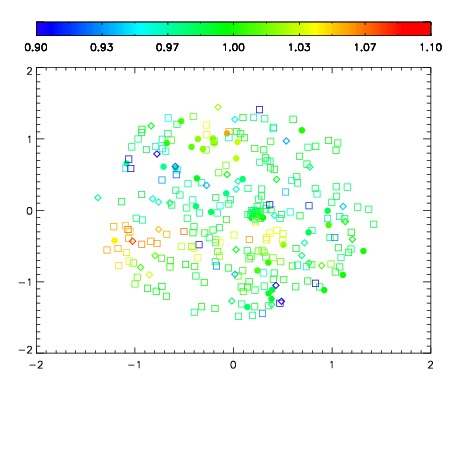
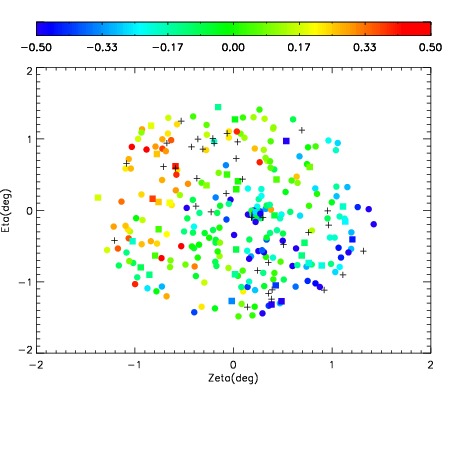
| Spatial sky telluric CO2 absorption deviations (filled: H < 10)
|
| 4920058
| 47
| | Red | Green | Blue
| | z | | 19.07
| | znorm | | 14.89
| | sky | 14.9 | 14.6 | 14.7
| | S/N | 14.4 | 25.4 | 28.6
| | S/N(c) | 12.9 | 23.4 | 27.2
| | SN(E/C) 0.30
|
| 
| 
| 
| 
| 
|
| 4920059
| 47
| | Red | Green | Blue
| | z | | 18.88
| | znorm | | 14.70
| | sky | 14.5 | 14.2 | 14.4
| | S/N | 12.4 | 22.0 | 25.6
| | S/N(c) | 10.8 | 20.0 | 24.4
| | SN(E/C) 0.35
|
| 
| 
| 
| 
| 
|
| 4920060
| 47
| | Red | Green | Blue
| | z | | 18.63
| | znorm | | 14.45
| | sky | 14.0 | 13.9 | 14.0
| | S/N | 10.1 | 17.9 | 21.6
| | S/N(c) | 8.8 | 16.5 | 20.2
| | SN(E/C) 0.39
|
| 
| 
| 
| 
| 
|
| 4920061
| 47
| | Red | Green | Blue
| | z | | 18.34
| | znorm | | 14.16
| | sky | 13.6 | 13.5 | 13.5
| | S/N | 8.1 | 14.6 | 16.7
| | S/N(c) | 6.8 | 12.8 | 15.9
| | SN(E/C) 0.44
|
| 
| 
| 
| 
| 
|
| 4920062
| 47
| | Red | Green | Blue
| | z | | 18.15
| | znorm | | 13.97
| | sky | 13.4 | 13.3 | 13.4
| | S/N | 6.8 | 12.3 | 13.7
| | S/N(c) | 6.0 | 11.5 | 12.8
| | SN(E/C) 0.50
|
| 
| 
| 
| 
| 
|
| 4920063
| 47
| | Red | Green | Blue
| | z | | 16.94
| | znorm | | 12.76
| | sky | 12.9 | 12.8 | 12.9
| | S/N | 2.2 | 4.4 | 4.7
| | S/N(c) | 2.0 | 3.7 | 4.4
| | SN(E/C) 0.75
|
| 
| 
| 
| 
| 
|
| 4920064
| 47
| | Red | Green | Blue
| | z | | 15.15
| | znorm | | 10.97
| | sky | 12.8 | 12.7 | 12.7
| | S/N | 0.4 | 1.1 | 1.4
| | S/N(c) | 0.3 | 1.0 | 1.1
| | SN(E/C) 0.85
|
| 
| 
| 
| 
| 
|
| 4920065
| 47
| | Red | Green | Blue
| | z | | 16.48
| | znorm | | 12.30
| | sky | 12.9 | 12.8 | 12.9
| | S/N | 1.5 | 3.0 | 3.9
| | S/N(c) | 1.5 | 2.7 | 3.8
| | SN(E/C) 0.71
|
| 
| 
| 
| 
| 
|