| Red | Green | Blue | |
| z | 17.64 | ||
| znorm | Inf | ||
| sky | -Inf | -Inf | -Inf |
| S/N | 14.6 | 27.3 | 33.0 |
| S/N(c) | 0.0 | 0.0 | 0.0 |
| SN(E/C) |
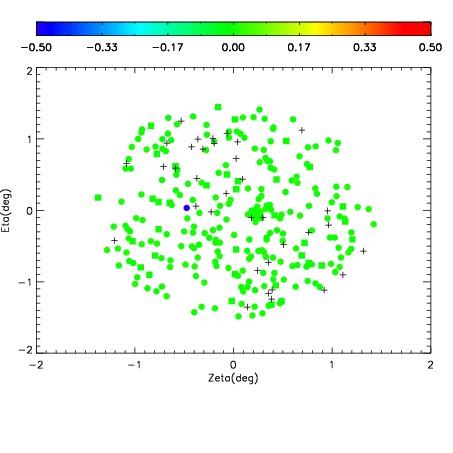
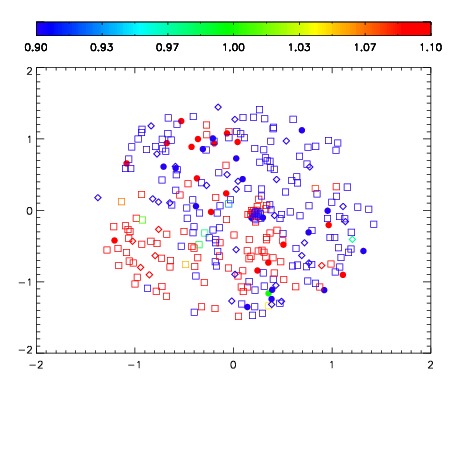


| Frame | Nreads | Zeropoints | Mag plots | Spatial mag deviation | Spatial sky 16325A emission deviations (filled: sky, open: star) | Spatial sky continuum emission | Spatial sky telluric CO2 absorption deviations (filled: H < 10) | |||||||||||||||||||||||
| 0 | 0 |
|
|
|
|
|
|
| IPAIR | NAME | SHIFT | NEWSHIFT | S/N | NAME | SHIFT | NEWSHIFT | S/N |
| 0 | 04920060 | 0.491397 | 0.00000 | 173.427 | 04920061 | 0.000476266 | 0.490921 | 150.384 |
| 1 | 04920059 | 0.489400 | 0.00199699 | 193.939 | 04920058 | 0.00000 | 0.491397 | 209.021 |
| 2 | 04920063 | 0.488312 | 0.00308499 | 77.6458 | 04920062 | 0.000772955 | 0.490624 | 132.793 |
| 3 | 04920064 | 0.490668 | 0.000728995 | 20.2320 | 04920065 | -0.000865304 | 0.492262 | 69.2983 |