| Red | Green | Blue | |
| z | 17.64 | ||
| znorm | Inf | ||
| sky | -Inf | -Inf | -Inf |
| S/N | 30.2 | 51.3 | 57.1 |
| S/N(c) | 0.0 | 0.0 | 0.0 |
| SN(E/C) |
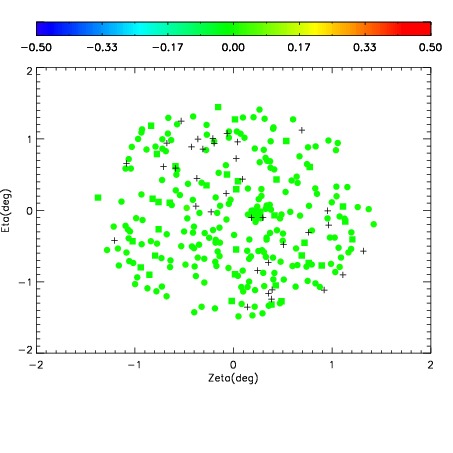
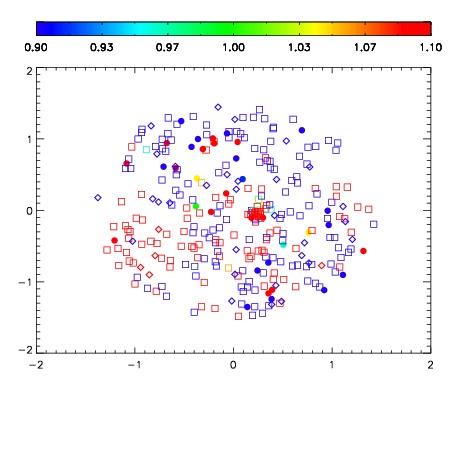
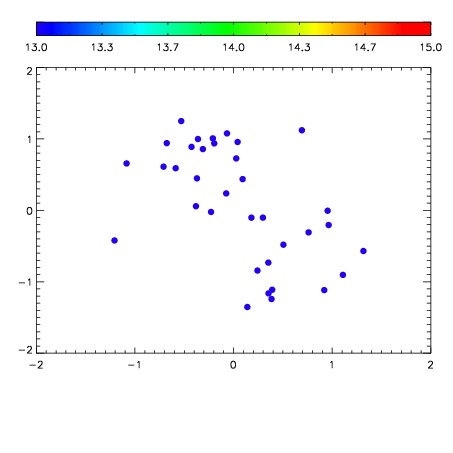

| Frame | Nreads | Zeropoints | Mag plots | Spatial mag deviation | Spatial sky 16325A emission deviations (filled: sky, open: star) | Spatial sky continuum emission | Spatial sky telluric CO2 absorption deviations (filled: H < 10) | |||||||||||||||||||||||
| 0 | 0 |
|
|
|
|
|
|
| IPAIR | NAME | SHIFT | NEWSHIFT | S/N | NAME | SHIFT | NEWSHIFT | S/N |
| 0 | 05220031 | 0.495259 | 0.00000 | 215.770 | 05220032 | 0.00447559 | 0.490783 | 216.853 |
| 1 | 05220030 | 0.495225 | 3.39746e-05 | 213.358 | 05220029 | 0.00123035 | 0.494029 | 215.248 |
| 2 | 05220026 | 0.494931 | 0.000327975 | 209.715 | 05220028 | 0.00198403 | 0.493275 | 211.869 |
| 3 | 05220027 | 0.494528 | 0.000730991 | 207.111 | 05220025 | 0.00000 | 0.495259 | 205.602 |