| Red | Green | Blue | |
| z | 17.64 | ||
| znorm | Inf | ||
| sky | -Inf | -Inf | -Inf |
| S/N | 30.2 | 48.3 | 53.9 |
| S/N(c) | 28.6 | 45.2 | 52.5 |
| SN(E/C) |
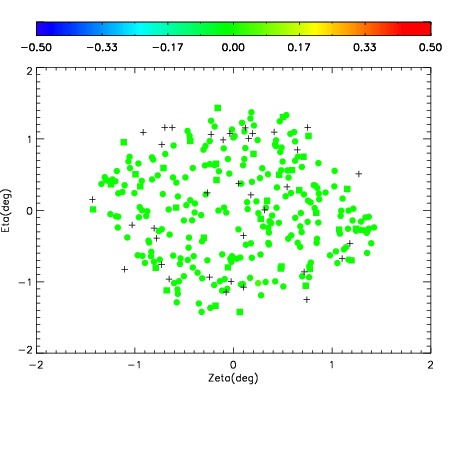


| Frame | Nreads | Zeropoints | Mag plots | Spatial mag deviation | Spatial sky 16325A emission deviations (filled: sky, open: star) | Spatial sky continuum emission | Spatial sky telluric CO2 absorption deviations (filled: H < 10) | |||||||||||||||||||||||
| 0 | 0 |
|
|
|
|
|
|
| IPAIR | NAME | SHIFT | NEWSHIFT | S/N | NAME | SHIFT | NEWSHIFT | S/N |
| 0 | 04650064 | 0.482743 | 0.00000 | 157.644 | 04650065 | -0.000393039 | 0.483136 | 171.334 |
| 1 | 04650059 | 0.462203 | 0.0205400 | 207.147 | 04650058 | 0.00000 | 0.482743 | 205.607 |
| 2 | 04650060 | 0.466303 | 0.0164400 | 195.715 | 04650062 | -0.00274081 | 0.485484 | 195.232 |
| 3 | 04650063 | 0.473894 | 0.00884899 | 183.194 | 04650061 | -0.000831521 | 0.483575 | 184.887 |