| Red | Green | Blue | |
| z | 17.64 | ||
| znorm | Inf | ||
| sky | -NaN | -Inf | -Inf |
| S/N | 21.9 | 38.2 | 38.1 |
| S/N(c) | 0.0 | 0.0 | 0.0 |
| SN(E/C) |
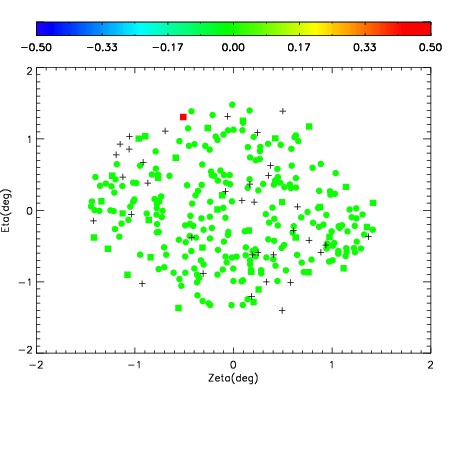
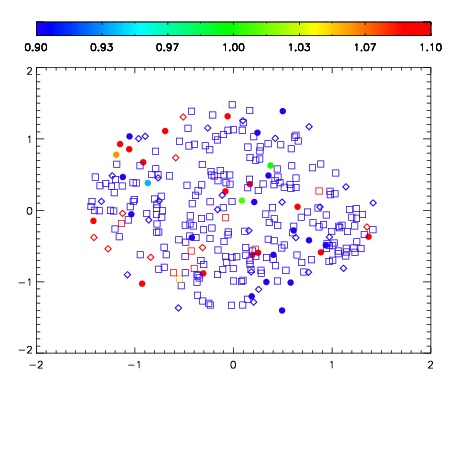
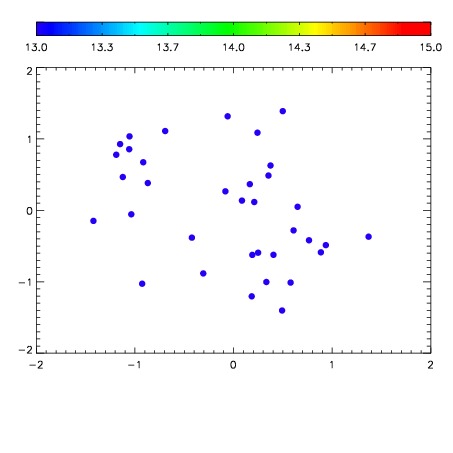

| Frame | Nreads | Zeropoints | Mag plots | Spatial mag deviation | Spatial sky 16325A emission deviations (filled: sky, open: star) | Spatial sky continuum emission | Spatial sky telluric CO2 absorption deviations (filled: H < 10) | |||||||||||||||||||||||
| 0 | 0 |
|
|
|
|
|
|
| IPAIR | NAME | SHIFT | NEWSHIFT | S/N | NAME | SHIFT | NEWSHIFT | S/N |
| 0 | 04630040 | 0.495211 | 0.00000 | 205.055 | 04630041 | 0.00207261 | 0.493138 | 205.376 |
| 1 | 04630036 | 0.487063 | 0.00814801 | 216.234 | 04630034 | 0.00000 | 0.495211 | 215.520 |
| 2 | 04630035 | 0.486939 | 0.00827199 | 216.193 | 04630037 | 0.00259707 | 0.492614 | 208.556 |
| 3 | 04630039 | 0.488900 | 0.00631100 | 203.728 | 04630038 | 0.00175656 | 0.493454 | 200.275 |