| Red | Green | Blue | |
| z | 17.64 | ||
| znorm | Inf | ||
| sky | -NaN | -Inf | -Inf |
| S/N | 26.8 | 44.2 | 44.9 |
| S/N(c) | 0.0 | 0.0 | 0.0 |
| SN(E/C) |
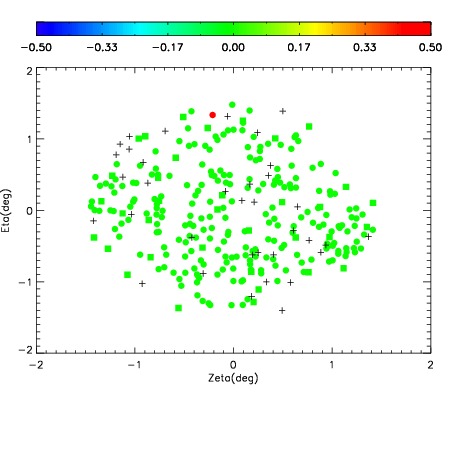
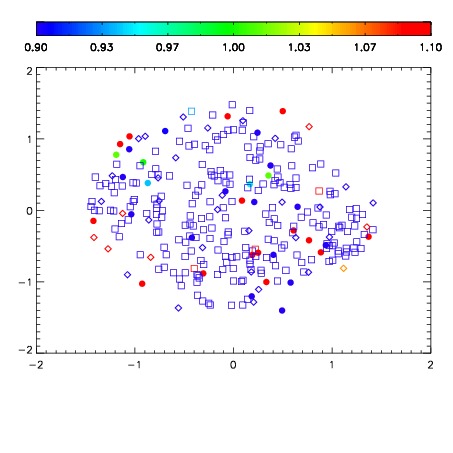
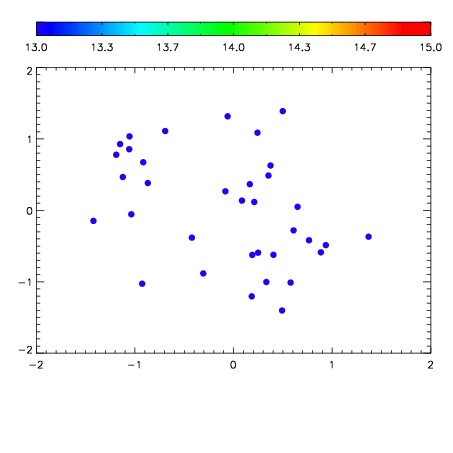

| Frame | Nreads | Zeropoints | Mag plots | Spatial mag deviation | Spatial sky 16325A emission deviations (filled: sky, open: star) | Spatial sky continuum emission | Spatial sky telluric CO2 absorption deviations (filled: H < 10) | |||||||||||||||||||||||
| 0 | 0 |
|
|
|
|
|
|
| IPAIR | NAME | SHIFT | NEWSHIFT | S/N | NAME | SHIFT | NEWSHIFT | S/N |
| 0 | 04890075 | 0.481663 | 0.00000 | 222.263 | 04890073 | 0.00000 | 0.481663 | 225.594 |
| 1 | 04890079 | 0.479374 | 0.00228900 | 235.018 | 04890077 | 0.000338379 | 0.481325 | 228.110 |
| 2 | 04890074 | 0.478018 | 0.00364500 | 234.955 | 04890080 | 0.00143424 | 0.480229 | 226.994 |
| 3 | 04890078 | 0.479393 | 0.00226998 | 229.614 | 04890076 | 0.00235377 | 0.479309 | 226.990 |