| Red | Green | Blue | |
| z | 17.64 | ||
| znorm | Inf | ||
| sky | -Inf | -Inf | -Inf |
| S/N | 25.5 | 43.5 | 47.7 |
| S/N(c) | 0.0 | 0.0 | 0.0 |
| SN(E/C) |
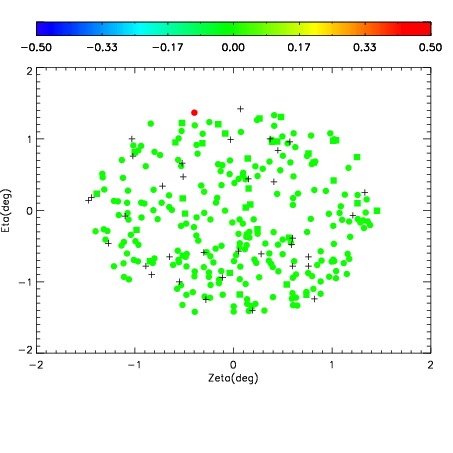
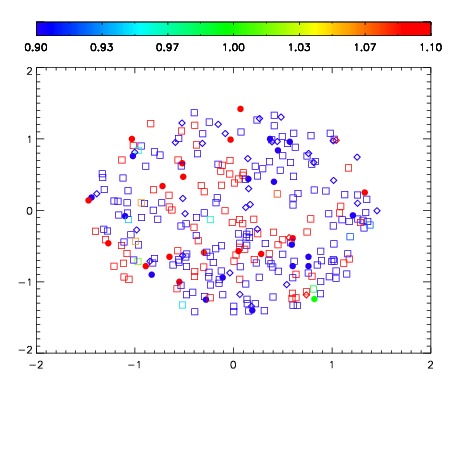
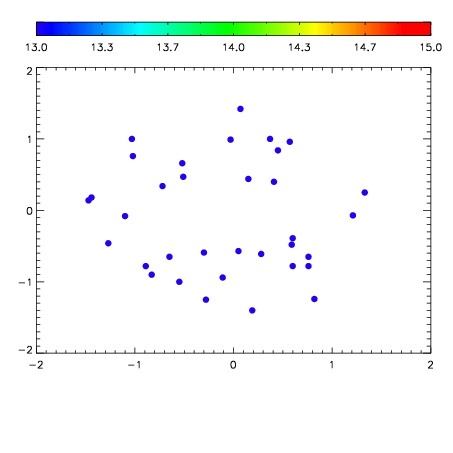

| Frame | Nreads | Zeropoints | Mag plots | Spatial mag deviation | Spatial sky 16325A emission deviations (filled: sky, open: star) | Spatial sky continuum emission | Spatial sky telluric CO2 absorption deviations (filled: H < 10) | |||||||||||||||||||||||
| 0 | 0 |
|
|
|
|
|
|
| IPAIR | NAME | SHIFT | NEWSHIFT | S/N | NAME | SHIFT | NEWSHIFT | S/N |
| 0 | 05180038 | 0.493717 | 0.00000 | 222.034 | 05180033 | 0.00000 | 0.493717 | 221.855 |
| 1 | 05180039 | 0.493246 | 0.000471026 | 225.402 | 05180036 | 0.00119423 | 0.492523 | 226.750 |
| 2 | 05180035 | 0.492926 | 0.000791013 | 225.016 | 05180037 | -0.000585537 | 0.494303 | 225.657 |
| 3 | 05180034 | 0.493546 | 0.000171006 | 223.106 | 05180040 | 0.00169499 | 0.492022 | 223.709 |