| Red | Green | Blue | |
| z | 17.64 | ||
| znorm | Inf | ||
| sky | -Inf | -Inf | -Inf |
| S/N | 23.0 | 39.2 | 44.1 |
| S/N(c) | 0.0 | 0.0 | 0.0 |
| SN(E/C) |
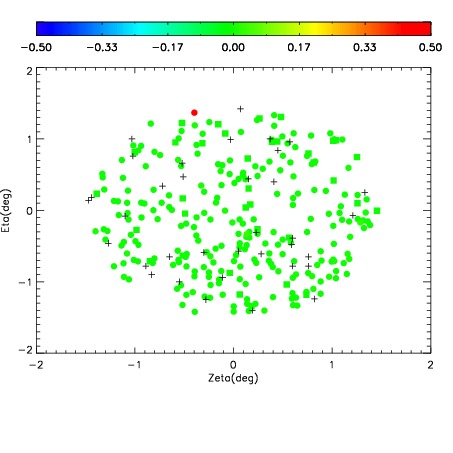
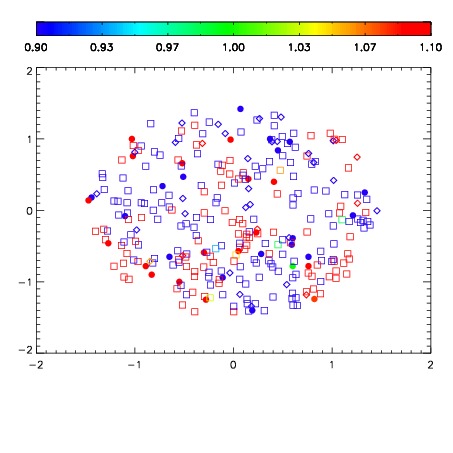
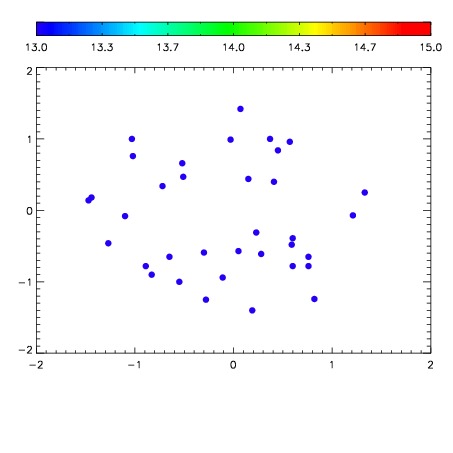

| Frame | Nreads | Zeropoints | Mag plots | Spatial mag deviation | Spatial sky 16325A emission deviations (filled: sky, open: star) | Spatial sky continuum emission | Spatial sky telluric CO2 absorption deviations (filled: H < 10) | |||||||||||||||||||||||
| 0 | 0 |
|
|
|
|
|
|
| IPAIR | NAME | SHIFT | NEWSHIFT | S/N | NAME | SHIFT | NEWSHIFT | S/N |
| 0 | 08730035 | 0.479513 | 0.00000 | 239.189 | 08730033 | 0.00000 | 0.479513 | 248.949 |
| 1 | 08730034 | 0.478672 | 0.000840992 | 236.575 | 08730037 | -0.000855965 | 0.480369 | 244.710 |
| 2 | 08730038 | 0.479223 | 0.000289977 | 227.027 | 08730036 | -0.000606698 | 0.480120 | 239.088 |
| 3 | 08730039 | 0.479483 | 2.99811e-05 | 225.579 | 08730040 | -5.55188e-05 | 0.479569 | 228.739 |