| Red | Green | Blue | |
| z | 17.64 | ||
| znorm | Inf | ||
| sky | -Inf | -Inf | -Inf |
| S/N | 25.6 | 43.3 | 46.3 |
| S/N(c) | 0.0 | 0.0 | 0.0 |
| SN(E/C) |
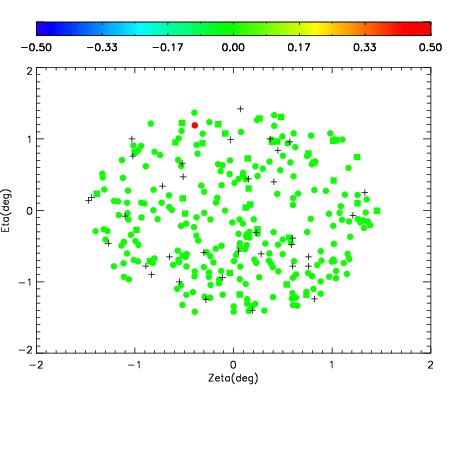
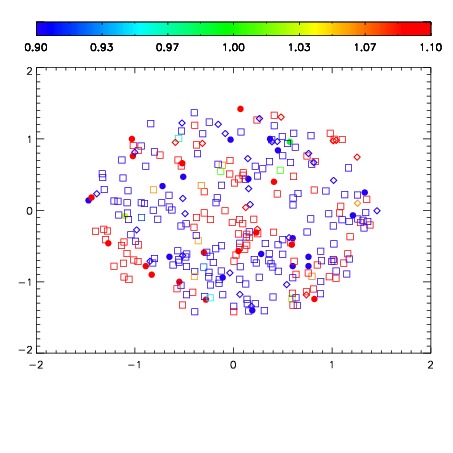
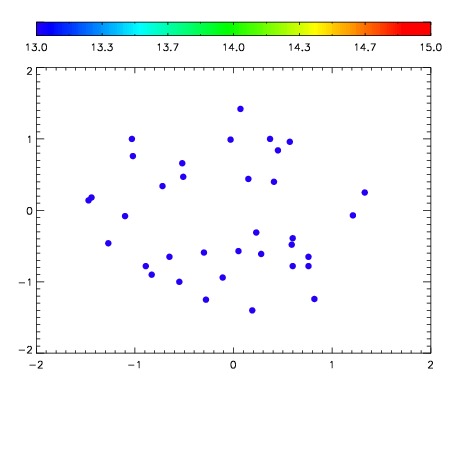

| Frame | Nreads | Zeropoints | Mag plots | Spatial mag deviation | Spatial sky 16325A emission deviations (filled: sky, open: star) | Spatial sky continuum emission | Spatial sky telluric CO2 absorption deviations (filled: H < 10) | |||||||||||||||||||||||
| 0 | 0 |
|
|
|
|
|
|
| IPAIR | NAME | SHIFT | NEWSHIFT | S/N | NAME | SHIFT | NEWSHIFT | S/N |
| 0 | 09050013 | 0.478511 | 0.00000 | 216.464 | 09050011 | 0.00000 | 0.478511 | 216.601 |
| 1 | 09050016 | 0.477236 | 0.00127500 | 209.399 | 09050014 | -0.000274746 | 0.478786 | 216.517 |
| 2 | 09050012 | 0.477948 | 0.000562996 | 209.116 | 09050015 | -0.000425111 | 0.478936 | 211.578 |
| 3 | 09050017 | 0.477978 | 0.000533015 | 208.092 | 09050018 | 0.000156153 | 0.478355 | 211.151 |