| Red | Green | Blue | |
| z | 17.64 | ||
| znorm | Inf | ||
| sky | -Inf | -Inf | -Inf |
| S/N | 25.7 | 45.6 | 50.9 |
| S/N(c) | 0.0 | 0.0 | 0.0 |
| SN(E/C) |
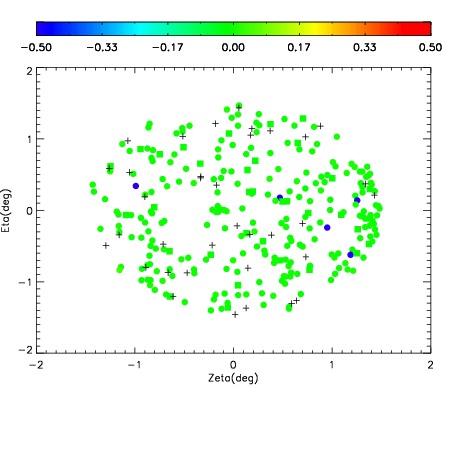
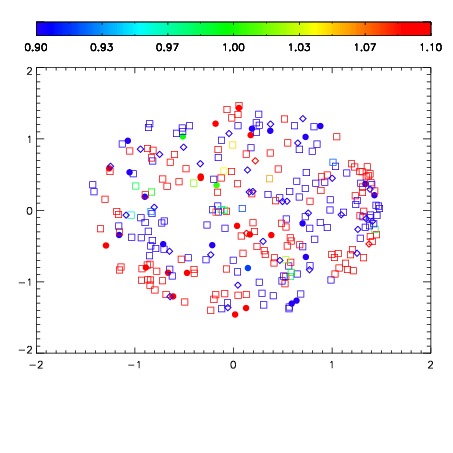
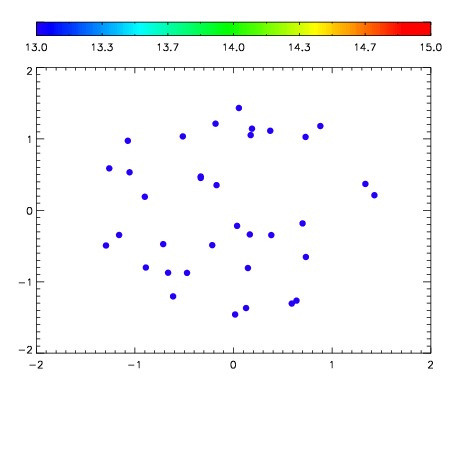

| Frame | Nreads | Zeropoints | Mag plots | Spatial mag deviation | Spatial sky 16325A emission deviations (filled: sky, open: star) | Spatial sky continuum emission | Spatial sky telluric CO2 absorption deviations (filled: H < 10) | |||||||||||||||||||||||
| 0 | 0 |
|
|
|
|
|
|
| IPAIR | NAME | SHIFT | NEWSHIFT | S/N | NAME | SHIFT | NEWSHIFT | S/N |
| 0 | 04900064 | 0.485688 | 0.00000 | 172.229 | 04900062 | -0.00140092 | 0.487089 | 184.161 |
| 1 | 04900060 | 0.485627 | 6.10054e-05 | 182.683 | 04900065 | -0.00200027 | 0.487688 | 188.704 |
| 2 | 04900059 | 0.485348 | 0.000340015 | 178.436 | 04900061 | -0.000738919 | 0.486427 | 184.531 |
| 3 | 04900063 | 0.485179 | 0.000508994 | 160.695 | 04900058 | 0.00000 | 0.485688 | 176.355 |