| Red | Green | Blue | |
| z | 17.64 | ||
| znorm | Inf | ||
| sky | -Inf | -Inf | -Inf |
| S/N | 24.5 | 46.1 | 51.7 |
| S/N(c) | 0.0 | 0.0 | 0.0 |
| SN(E/C) |
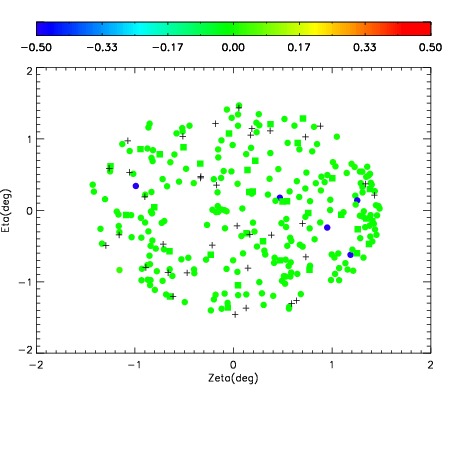
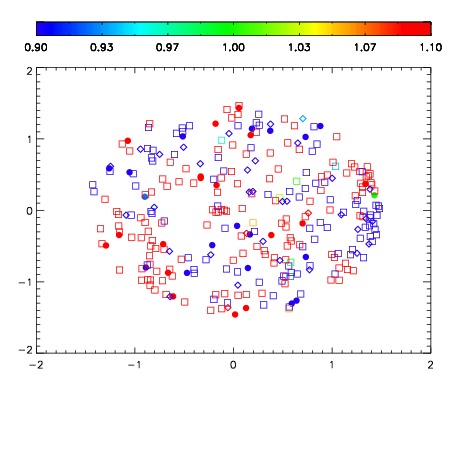
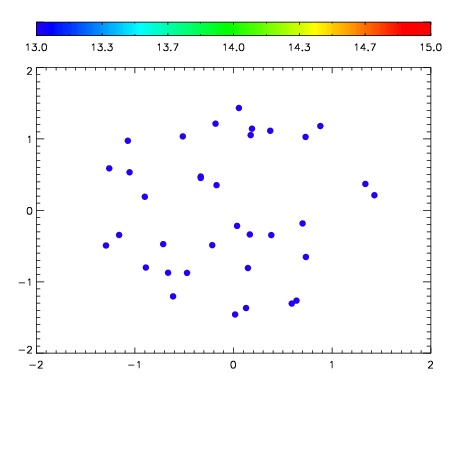

| Frame | Nreads | Zeropoints | Mag plots | Spatial mag deviation | Spatial sky 16325A emission deviations (filled: sky, open: star) | Spatial sky continuum emission | Spatial sky telluric CO2 absorption deviations (filled: H < 10) | |||||||||||||||||||||||
| 0 | 0 |
|
|
|
|
|
|
| IPAIR | NAME | SHIFT | NEWSHIFT | S/N | NAME | SHIFT | NEWSHIFT | S/N |
| 0 | 05200042 | 0.492985 | 0.00000 | 187.644 | 05200043 | -0.000955148 | 0.493940 | 191.160 |
| 1 | 05200038 | 0.489003 | 0.00398201 | 197.744 | 05200036 | 0.00000 | 0.492985 | 199.818 |
| 2 | 05200041 | 0.490144 | 0.00284100 | 193.100 | 05200039 | -0.00274456 | 0.495730 | 194.339 |
| 3 | 05200037 | 0.489433 | 0.00355202 | 188.156 | 05200040 | -0.00517363 | 0.498159 | 194.208 |