| Red | Green | Blue | |
| z | 17.64 | ||
| znorm | Inf | ||
| sky | -Inf | -Inf | -Inf |
| S/N | 16.5 | 30.9 | 34.6 |
| S/N(c) | 0.0 | 0.0 | 0.0 |
| SN(E/C) |
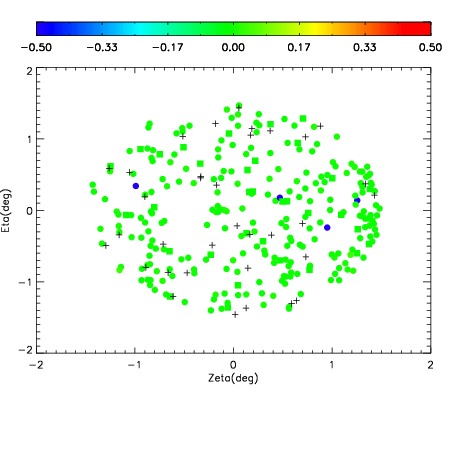
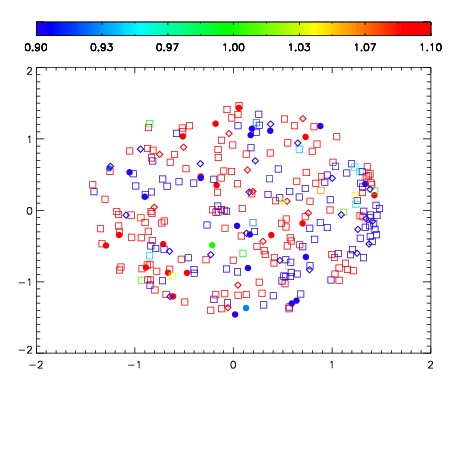
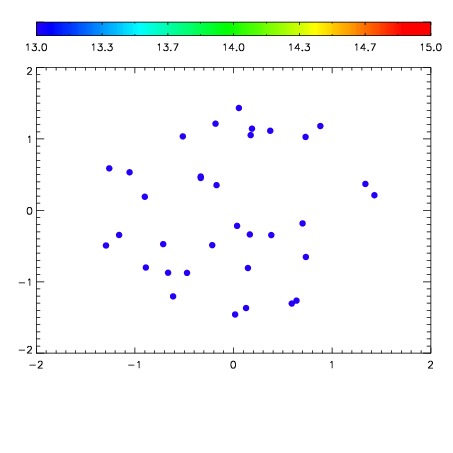

| Frame | Nreads | Zeropoints | Mag plots | Spatial mag deviation | Spatial sky 16325A emission deviations (filled: sky, open: star) | Spatial sky continuum emission | Spatial sky telluric CO2 absorption deviations (filled: H < 10) | |||||||||||||||||||||||
| 0 | 0 |
|
|
|
|
|
|
| IPAIR | NAME | SHIFT | NEWSHIFT | S/N | NAME | SHIFT | NEWSHIFT | S/N |
| 0 | 05470025 | 0.492678 | 0.00000 | 110.731 | 05470026 | 0.00208717 | 0.490591 | 92.7098 |
| 1 | 05470029 | 0.489645 | 0.00303298 | 134.805 | 05470023 | 0.00000 | 0.492678 | 138.103 |
| 2 | 05470024 | 0.491018 | 0.00165999 | 132.148 | 05470030 | 0.000936091 | 0.491742 | 135.195 |
| 3 | 05470028 | 0.490323 | 0.00235498 | 131.543 | 05470027 | 0.000295010 | 0.492383 | 124.910 |