| Red | Green | Blue | |
| z | 17.64 | ||
| znorm | Inf | ||
| sky | -Inf | -Inf | -Inf |
| S/N | 26.2 | 47.1 | 51.7 |
| S/N(c) | 0.0 | 0.0 | 0.0 |
| SN(E/C) |

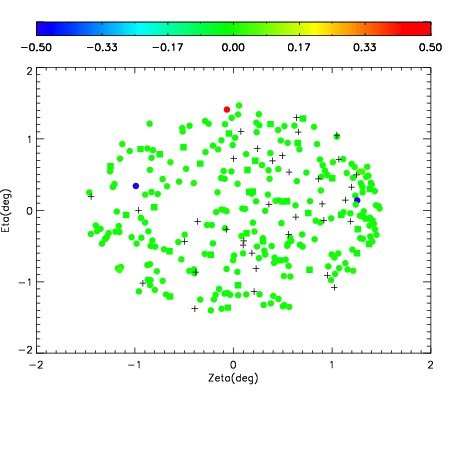
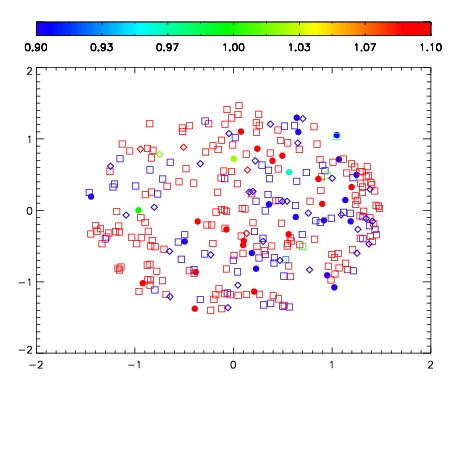
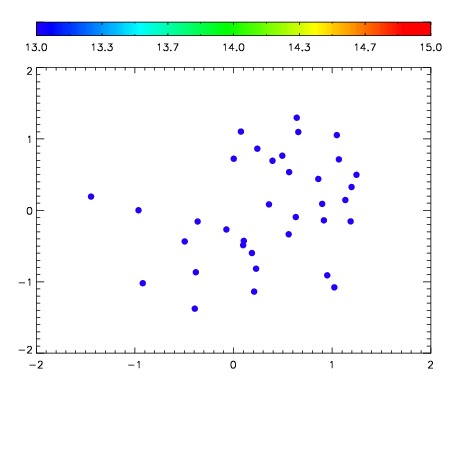

| Frame | Nreads | Zeropoints | Mag plots | Spatial mag deviation | Spatial sky 16325A emission deviations (filled: sky, open: star) | Spatial sky continuum emission | Spatial sky telluric CO2 absorption deviations (filled: H < 10) | |||||||||||||||||||||||
| 0 | 0 |
|
|
|
|
|
|
| IPAIR | NAME | SHIFT | NEWSHIFT | S/N | NAME | SHIFT | NEWSHIFT | S/N |
| 0 | 04910064 | 0.489304 | 0.00000 | 222.218 | 04910065 | 0.00372642 | 0.485578 | 224.588 |
| 1 | 04910063 | 0.488311 | 0.000993013 | 222.058 | 04910062 | 0.000546928 | 0.488757 | 224.470 |
| 2 | 04910060 | 0.489234 | 7.00057e-05 | 213.241 | 04910061 | 0.00298112 | 0.486323 | 222.938 |
| 3 | 04910059 | 0.487106 | 0.00219801 | 190.781 | 04910058 | 0.00000 | 0.489304 | 202.254 |