| Red | Green | Blue | |
| z | 17.64 | ||
| znorm | Inf | ||
| sky | -Inf | -Inf | -Inf |
| S/N | 12.6 | 23.8 | 30.2 |
| S/N(c) | 0.0 | 0.0 | 0.0 |
| SN(E/C) |
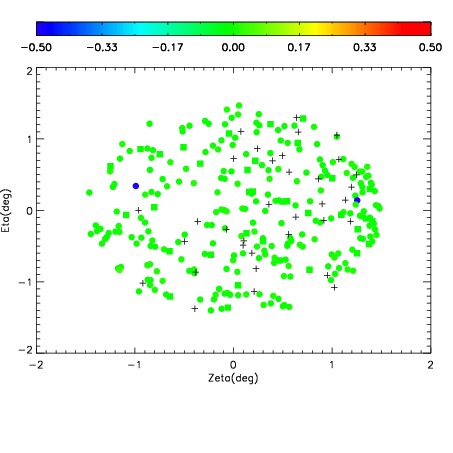
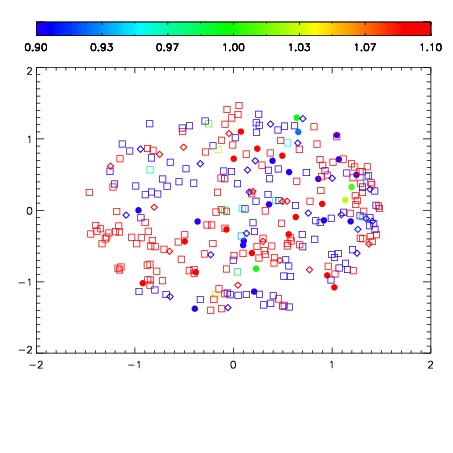


| Frame | Nreads | Zeropoints | Mag plots | Spatial mag deviation | Spatial sky 16325A emission deviations (filled: sky, open: star) | Spatial sky continuum emission | Spatial sky telluric CO2 absorption deviations (filled: H < 10) | |||||||||||||||||||||||
| 0 | 0 |
|
|
|
|
|
|
| IPAIR | NAME | SHIFT | NEWSHIFT | S/N | NAME | SHIFT | NEWSHIFT | S/N |
| 0 | 05210054 | 0.501741 | 0.00000 | 125.580 | 05210055 | 0.00607663 | 0.495664 | 133.787 |
| 1 | 05210049 | 0.500117 | 0.00162399 | 135.373 | 05210048 | 0.00000 | 0.501741 | 138.974 |
| 2 | 05210053 | 0.500069 | 0.00167197 | 130.207 | 05210052 | 0.00290977 | 0.498831 | 135.309 |
| 3 | 05210050 | 0.501180 | 0.000560999 | 116.807 | 05210051 | 0.00234371 | 0.499397 | 122.041 |