| Red | Green | Blue | |
| z | 17.64 | ||
| znorm | Inf | ||
| sky | -NaN | -Inf | -Inf |
| S/N | 25.6 | 44.5 | 51.1 |
| S/N(c) | 0.0 | 0.0 | 0.0 |
| SN(E/C) |
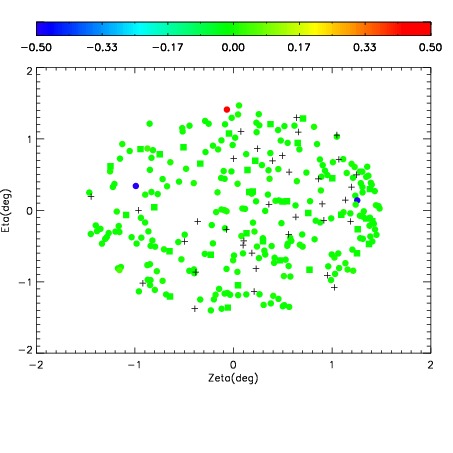
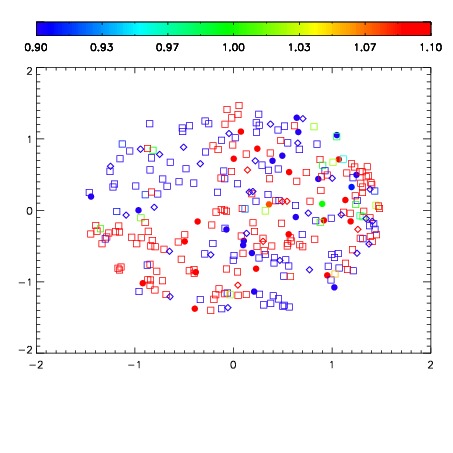
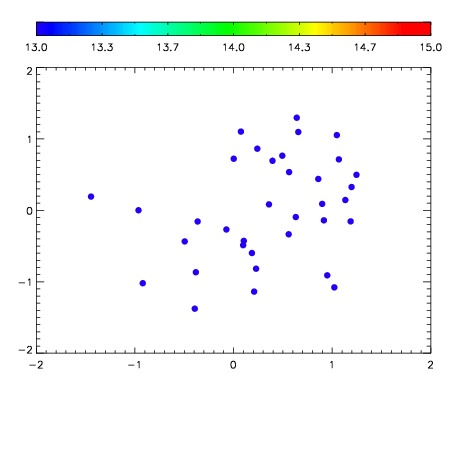

| Frame | Nreads | Zeropoints | Mag plots | Spatial mag deviation | Spatial sky 16325A emission deviations (filled: sky, open: star) | Spatial sky continuum emission | Spatial sky telluric CO2 absorption deviations (filled: H < 10) | |||||||||||||||||||||||
| 0 | 0 |
|
|
|
|
|
|
| IPAIR | NAME | SHIFT | NEWSHIFT | S/N | NAME | SHIFT | NEWSHIFT | S/N |
| 0 | 05260015 | 0.485900 | 0.00000 | 211.689 | 05260020 | 0.000238347 | 0.485662 | 212.780 |
| 1 | 05260019 | 0.485289 | 0.000611007 | 216.331 | 05260013 | 0.00000 | 0.485900 | 212.879 |
| 2 | 05260018 | 0.485143 | 0.000757009 | 209.562 | 05260017 | -0.000482435 | 0.486382 | 210.305 |
| 3 | 05260014 | 0.485403 | 0.000497013 | 204.104 | 05260016 | 0.000867132 | 0.485033 | 208.652 |