| Red | Green | Blue | |
| z | 17.63 | ||
| znorm | Inf | ||
| sky | -NaN | -NaN | -Inf |
| S/N | 32.3 | 44.7 | 34.5 |
| S/N(c) | 0.0 | 0.0 | 0.0 |
| SN(E/C) |
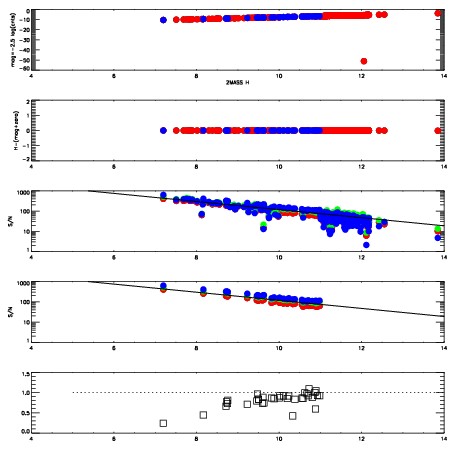
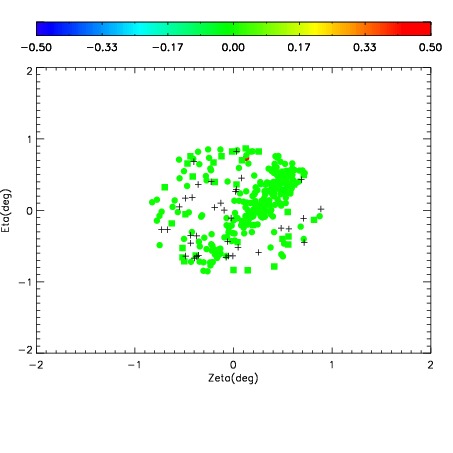
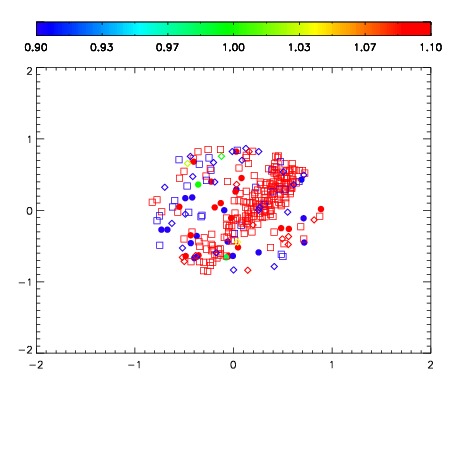
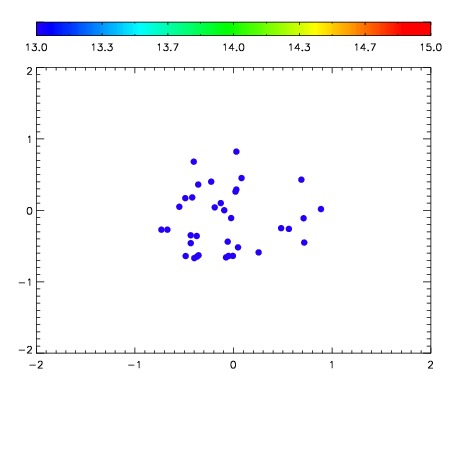

| Frame | Nreads | Zeropoints | Mag plots | Spatial mag deviation | Spatial sky 16325A emission deviations (filled: sky, open: star) | Spatial sky continuum emission | Spatial sky telluric CO2 absorption deviations (filled: H < 10) | |||||||||||||||||||||||
| 0 | 0 |
|
|
|
|
|
|
| IPAIR | NAME | SHIFT | NEWSHIFT | S/N | NAME | SHIFT | NEWSHIFT | S/N |
| 0 | 05240058 | 0.496888 | 0.00000 | 204.525 | 05240055 | 0.00299309 | 0.493895 | 196.331 |
| 1 | 05240054 | 0.496354 | 0.000533998 | 211.177 | 05240056 | 0.00217079 | 0.494717 | 200.260 |
| 2 | 05240053 | 0.494492 | 0.00239602 | 197.397 | 05240059 | 0.00334195 | 0.493546 | 187.572 |
| 3 | 05240057 | 0.496069 | 0.000818998 | 184.459 | 05240052 | 0.00000 | 0.496888 | 186.970 |