| Red | Green | Blue | |
| z | 17.63 | ||
| znorm | 13.45 | ||
| sky | -NaN | -NaN | 17.8 |
| S/N | 12.1 | 16.8 | 12.7 |
| S/N(c) | 0.0 | 0.0 | 0.0 |
| SN(E/C) |
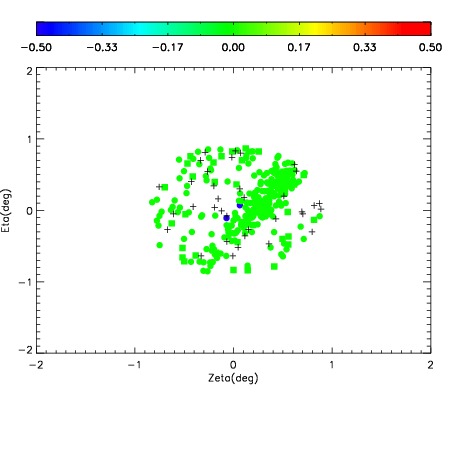
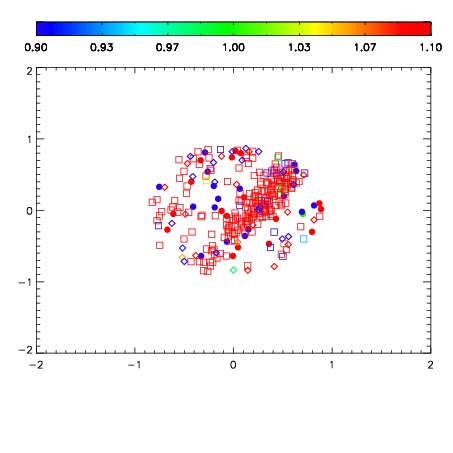
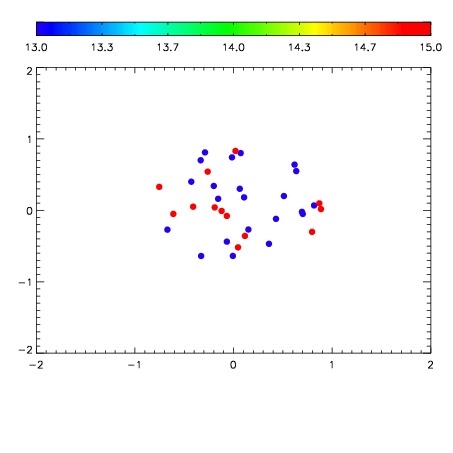

| Frame | Nreads | Zeropoints | Mag plots | Spatial mag deviation | Spatial sky 16325A emission deviations (filled: sky, open: star) | Spatial sky continuum emission | Spatial sky telluric CO2 absorption deviations (filled: H < 10) | |||||||||||||||||||||||
| 0 | 47 |
|
|
|
|
|
|
| IPAIR | NAME | SHIFT | NEWSHIFT | S/N | NAME | SHIFT | NEWSHIFT | S/N |
| 0 | 08310012 | 0.519233 | 0.00000 | 138.152 | 08310011 | 0.00000 | 0.519233 | 122.512 |