| Red | Green | Blue | |
| z | 17.63 | ||
| znorm | Inf | ||
| sky | -NaN | -NaN | -Inf |
| S/N | 19.4 | 25.6 | 21.8 |
| S/N(c) | 0.0 | 0.0 | 0.0 |
| SN(E/C) |

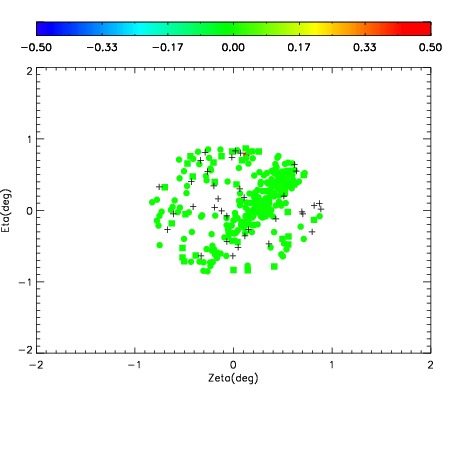

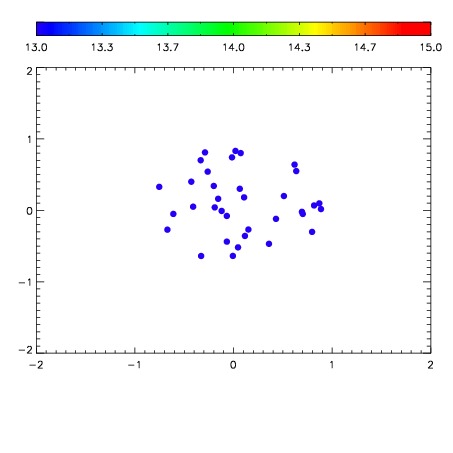

| Frame | Nreads | Zeropoints | Mag plots | Spatial mag deviation | Spatial sky 16325A emission deviations (filled: sky, open: star) | Spatial sky continuum emission | Spatial sky telluric CO2 absorption deviations (filled: H < 10) | |||||||||||||||||||||||
| 0 | 0 |
|
|
|
|
|
|
| IPAIR | NAME | SHIFT | NEWSHIFT | S/N | NAME | SHIFT | NEWSHIFT | S/N |
| 0 | 08480074 | 0.485621 | 0.00000 | 116.269 | 08480068 | 0.00000 | 0.485621 | 109.874 |
| 1 | 08480073 | 0.484787 | 0.000834018 | 121.071 | 08480075 | 0.00200841 | 0.483613 | 118.882 |
| 2 | 08480070 | 0.484074 | 0.00154701 | 111.109 | 08480072 | -0.000520839 | 0.486142 | 108.385 |
| 3 | 08480069 | 0.484274 | 0.00134701 | 105.962 | 08480071 | 0.000730443 | 0.484891 | 103.298 |