| Red | Green | Blue | |
| z | 17.63 | ||
| znorm | Inf | ||
| sky | -NaN | -NaN | -Inf |
| S/N | 24.4 | 32.6 | 23.5 |
| S/N(c) | 0.0 | 0.0 | 0.0 |
| SN(E/C) |
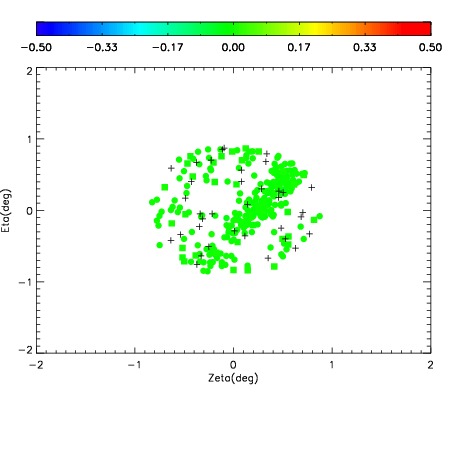
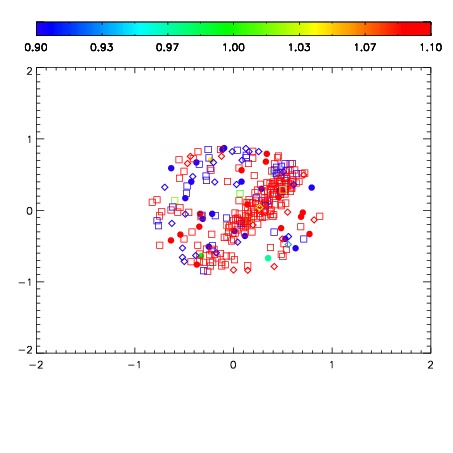
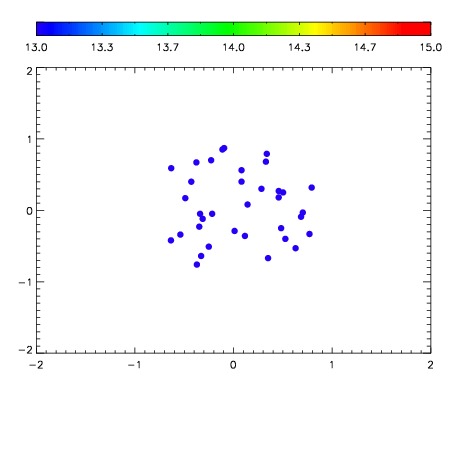

| Frame | Nreads | Zeropoints | Mag plots | Spatial mag deviation | Spatial sky 16325A emission deviations (filled: sky, open: star) | Spatial sky continuum emission | Spatial sky telluric CO2 absorption deviations (filled: H < 10) | |||||||||||||||||||||||
| 0 | 0 |
|
|
|
|
|
|
| IPAIR | NAME | SHIFT | NEWSHIFT | S/N | NAME | SHIFT | NEWSHIFT | S/N |
| 0 | 08320012 | 0.521449 | 0.00000 | 147.738 | 08320013 | 0.00217943 | 0.519270 | 157.132 |
| 1 | 08320015 | 0.520616 | 0.000833035 | 160.544 | 08320014 | 0.00151853 | 0.519930 | 159.180 |
| 2 | 08320011 | 0.520582 | 0.000867009 | 133.974 | 08320010 | 0.00000 | 0.521449 | 142.022 |