| Red | Green | Blue | |
| z | 17.64 | ||
| znorm | Inf | ||
| sky | -Inf | -Inf | -Inf |
| S/N | 20.5 | 32.8 | 37.8 |
| S/N(c) | 0.0 | 0.0 | 0.0 |
| SN(E/C) |
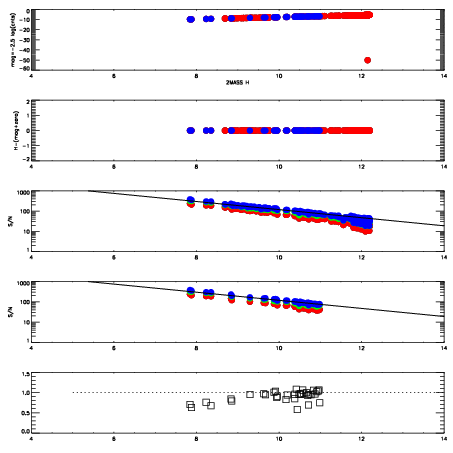
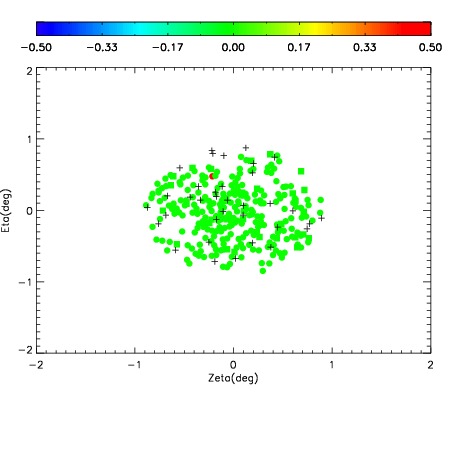
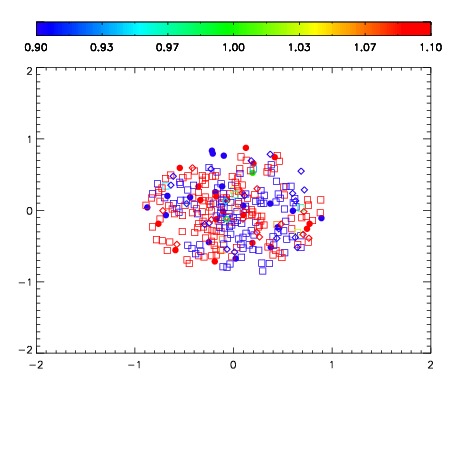
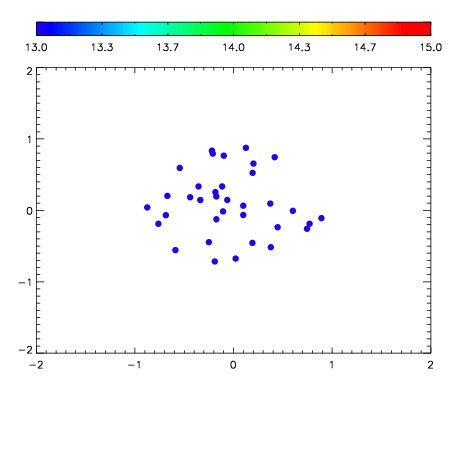

| Frame | Nreads | Zeropoints | Mag plots | Spatial mag deviation | Spatial sky 16325A emission deviations (filled: sky, open: star) | Spatial sky continuum emission | Spatial sky telluric CO2 absorption deviations (filled: H < 10) | |||||||||||||||||||||||
| 0 | 0 |
|
|
|
|
|
|
| IPAIR | NAME | SHIFT | NEWSHIFT | S/N | NAME | SHIFT | NEWSHIFT | S/N |
| 0 | 05180057 | 0.503564 | 0.00000 | 192.521 | 05180058 | 0.00143080 | 0.502133 | 181.532 |
| 1 | 05180056 | 0.496976 | 0.00658801 | 196.207 | 05180055 | 0.00000 | 0.503564 | 191.153 |
| 2 | 05180060 | 0.496943 | 0.00662100 | 170.045 | 05180059 | 0.00113571 | 0.502428 | 139.576 |
| 3 | 05180061 | 0.497380 | 0.00618401 | 97.8464 | 05180062 | 0.00316478 | 0.500399 | 25.2222 |