| Red | Green | Blue | |
| z | 17.64 | ||
| znorm | Inf | ||
| sky | -Inf | -Inf | -Inf |
| S/N | 26.1 | 43.8 | 46.9 |
| S/N(c) | 0.0 | 0.0 | 0.0 |
| SN(E/C) |

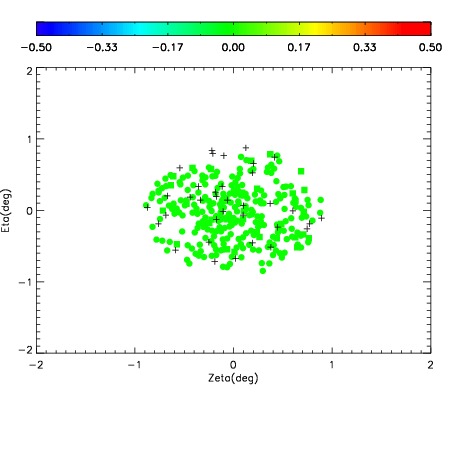
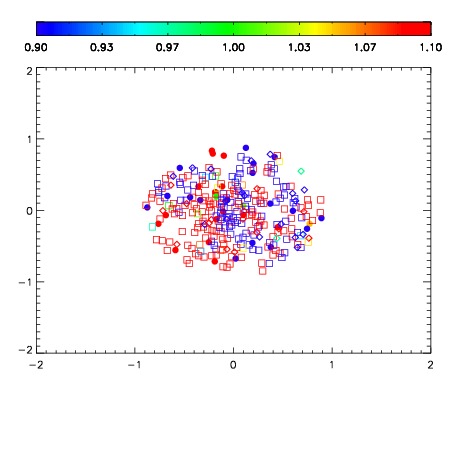
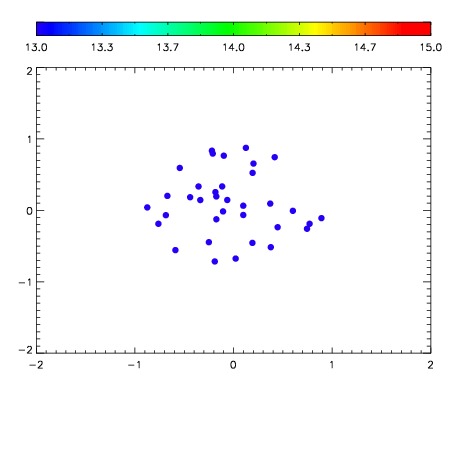

| Frame | Nreads | Zeropoints | Mag plots | Spatial mag deviation | Spatial sky 16325A emission deviations (filled: sky, open: star) | Spatial sky continuum emission | Spatial sky telluric CO2 absorption deviations (filled: H < 10) | |||||||||||||||||||||||
| 0 | 0 |
|
|
|
|
|
|
| IPAIR | NAME | SHIFT | NEWSHIFT | S/N | NAME | SHIFT | NEWSHIFT | S/N |
| 0 | 05250028 | 0.489724 | 0.00000 | 173.202 | 05250029 | -0.000166968 | 0.489891 | 176.810 |
| 1 | 05250032 | 0.489171 | 0.000553012 | 185.046 | 05250030 | 0.00182431 | 0.487900 | 182.317 |
| 2 | 05250031 | 0.489387 | 0.000337005 | 184.579 | 05250033 | 0.00221010 | 0.487514 | 177.184 |
| 3 | 05250027 | 0.488739 | 0.000984997 | 171.951 | 05250026 | 0.00000 | 0.489724 | 172.400 |