| Red | Green | Blue | |
| z | 17.64 | ||
| znorm | Inf | ||
| sky | -Inf | -Inf | -Inf |
| S/N | 24.4 | 40.4 | 41.8 |
| S/N(c) | 0.0 | 0.0 | 0.0 |
| SN(E/C) |


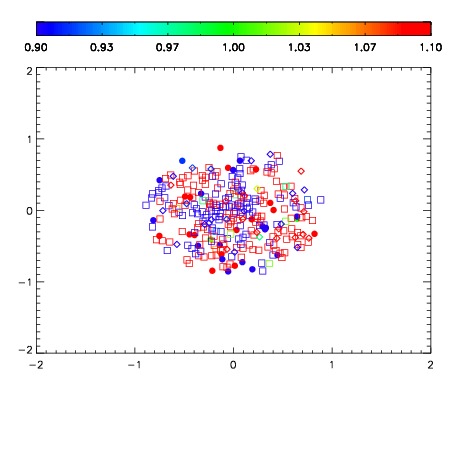
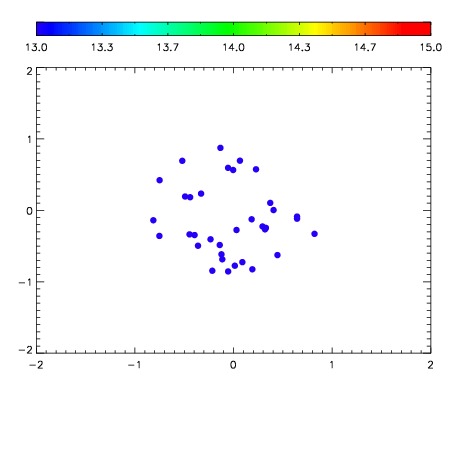

| Frame | Nreads | Zeropoints | Mag plots | Spatial mag deviation | Spatial sky 16325A emission deviations (filled: sky, open: star) | Spatial sky continuum emission | Spatial sky telluric CO2 absorption deviations (filled: H < 10) | |||||||||||||||||||||||
| 0 | 0 |
|
|
|
|
|
|
| IPAIR | NAME | SHIFT | NEWSHIFT | S/N | NAME | SHIFT | NEWSHIFT | S/N |
| 0 | 06020017 | 0.490669 | 0.00000 | 164.968 | 06020011 | 0.00000 | 0.490669 | 174.632 |
| 1 | 06020013 | 0.489872 | 0.000797004 | 188.591 | 06020015 | -0.00112681 | 0.491796 | 192.087 |
| 2 | 06020016 | 0.490508 | 0.000161022 | 186.873 | 06020014 | 0.00269498 | 0.487974 | 188.673 |
| 3 | 06020012 | 0.488613 | 0.00205600 | 180.457 | 06020018 | 0.000780716 | 0.489888 | 176.243 |