| Red | Green | Blue | |
| z | 17.64 | ||
| znorm | Inf | ||
| sky | -Inf | -NaN | -Inf |
| S/N | 19.2 | 33.2 | 34.7 |
| S/N(c) | 0.0 | 0.0 | 0.0 |
| SN(E/C) |
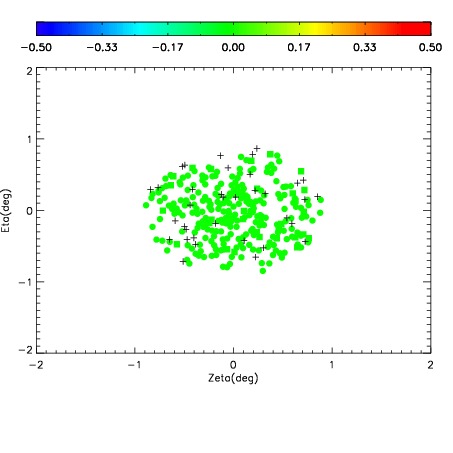
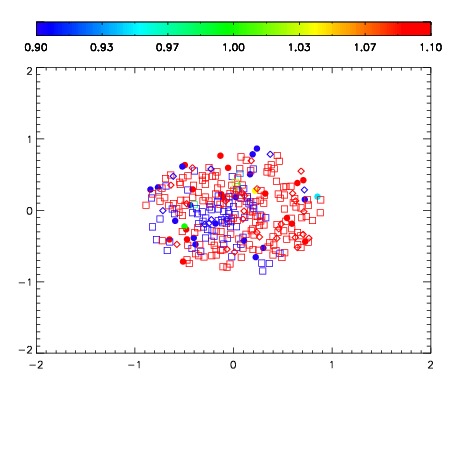
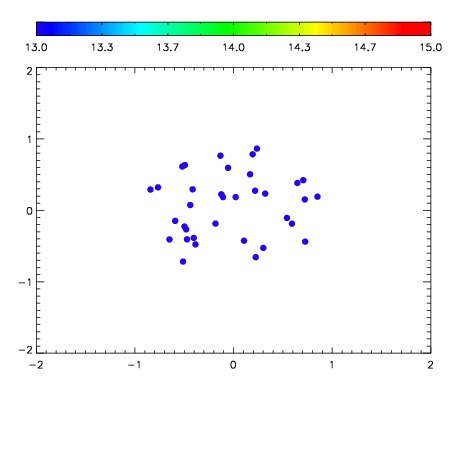

| Frame | Nreads | Zeropoints | Mag plots | Spatial mag deviation | Spatial sky 16325A emission deviations (filled: sky, open: star) | Spatial sky continuum emission | Spatial sky telluric CO2 absorption deviations (filled: H < 10) | |||||||||||||||||||||||
| 0 | 0 |
|
|
|
|
|
|
| IPAIR | NAME | SHIFT | NEWSHIFT | S/N | NAME | SHIFT | NEWSHIFT | S/N |
| 0 | 06090016 | 0.479226 | 0.00000 | 164.002 | 06090014 | -0.000611182 | 0.479837 | 151.684 |
| 1 | 06090015 | 0.478927 | 0.000299007 | 173.156 | 06090010 | 0.00000 | 0.479226 | 164.809 |
| 2 | 06090011 | 0.478275 | 0.000950992 | 171.570 | 06090013 | 0.000266571 | 0.478959 | 157.269 |
| 3 | 06090012 | 0.477898 | 0.00132799 | 162.491 | 06090017 | -0.00360441 | 0.482830 | 151.150 |