| Red | Green | Blue | |
| z | 17.64 | ||
| znorm | Inf | ||
| sky | -Inf | -Inf | -Inf |
| S/N | 32.6 | 47.2 | 50.9 |
| S/N(c) | 0.0 | 0.0 | 0.0 |
| SN(E/C) |
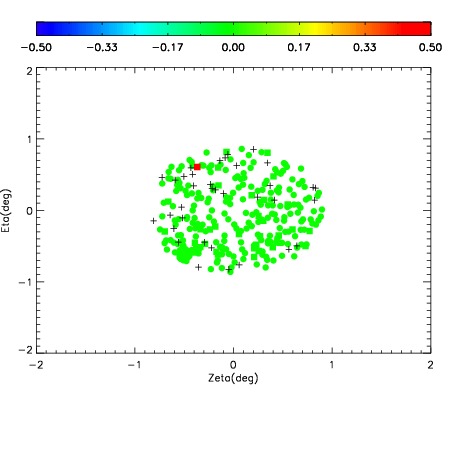
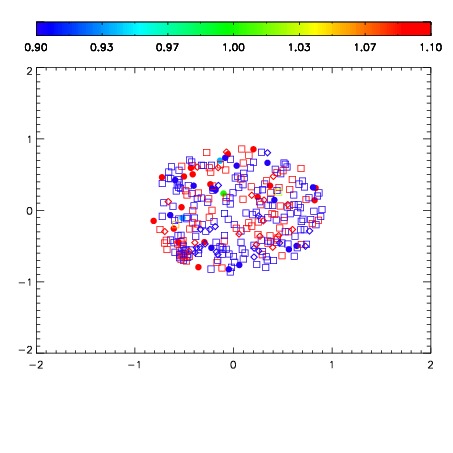
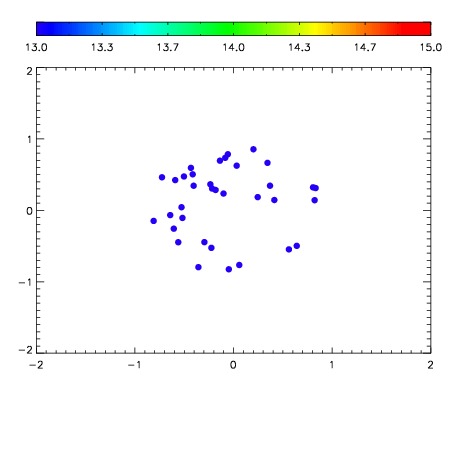

| Frame | Nreads | Zeropoints | Mag plots | Spatial mag deviation | Spatial sky 16325A emission deviations (filled: sky, open: star) | Spatial sky continuum emission | Spatial sky telluric CO2 absorption deviations (filled: H < 10) | |||||||||||||||||||||||
| 0 | 0 |
|
|
|
|
|
|
| IPAIR | NAME | SHIFT | NEWSHIFT | S/N | NAME | SHIFT | NEWSHIFT | S/N |
| 0 | 08440064 | 0.486084 | 0.00000 | 211.061 | 08440065 | -0.00102103 | 0.487105 | 217.072 |
| 1 | 08440060 | 0.485468 | 0.000616014 | 209.859 | 08440062 | -0.000191709 | 0.486276 | 212.391 |
| 2 | 08440063 | 0.485016 | 0.00106803 | 209.278 | 08440061 | 0.000295533 | 0.485788 | 210.929 |
| 3 | 08440059 | 0.484717 | 0.00136700 | 207.936 | 08440058 | 0.00000 | 0.486084 | 206.990 |