| Red | Green | Blue | |
| z | 17.63 | ||
| znorm | Inf | ||
| sky | -NaN | -NaN | -NaN |
| S/N | 19.7 | 28.9 | 29.3 |
| S/N(c) | 0.0 | 0.0 | 0.0 |
| SN(E/C) |

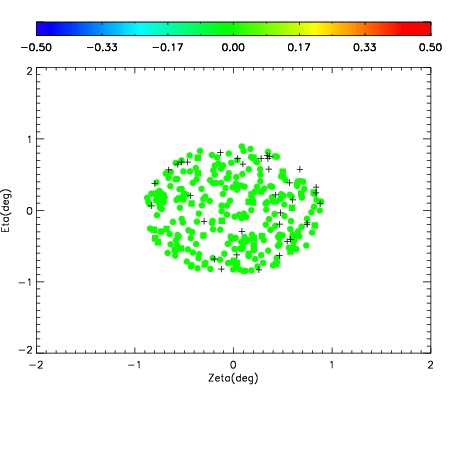
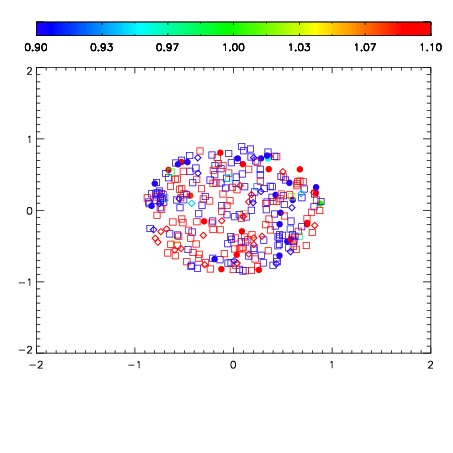
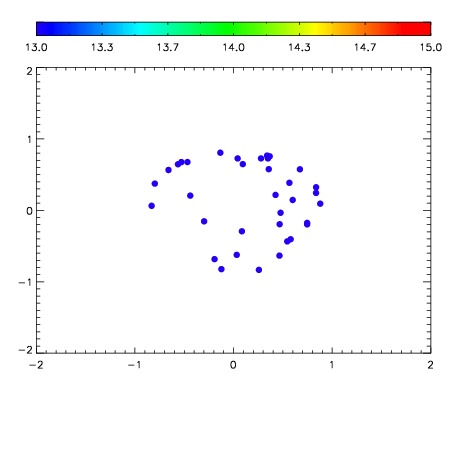

| Frame | Nreads | Zeropoints | Mag plots | Spatial mag deviation | Spatial sky 16325A emission deviations (filled: sky, open: star) | Spatial sky continuum emission | Spatial sky telluric CO2 absorption deviations (filled: H < 10) | |||||||||||||||||||||||
| 0 | 0 |
|
|
|
|
|
|
| IPAIR | NAME | SHIFT | NEWSHIFT | S/N | NAME | SHIFT | NEWSHIFT | S/N |
| 0 | 09090017 | 0.481481 | 0.00000 | 114.403 | 09090011 | 0.00000 | 0.481481 | 160.219 |
| 1 | 09090013 | 0.476277 | 0.00520399 | 171.499 | 09090018 | 0.000138491 | 0.481342 | 178.638 |
| 2 | 09090012 | 0.477861 | 0.00362000 | 145.948 | 09090014 | -0.00117760 | 0.482659 | 162.594 |