| Red | Green | Blue | |
| z | 17.63 | ||
| znorm | Inf | ||
| sky | -NaN | -NaN | -NaN |
| S/N | 35.4 | 50.1 | 52.9 |
| S/N(c) | 0.0 | 0.0 | 0.0 |
| SN(E/C) |
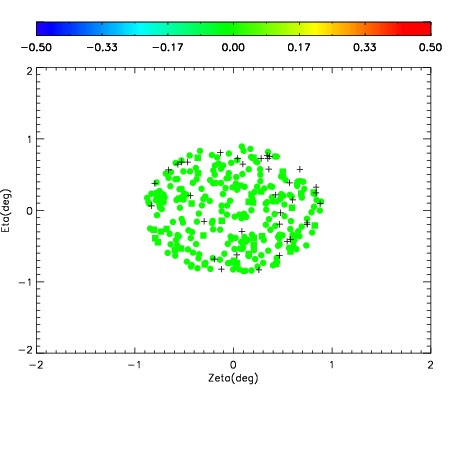
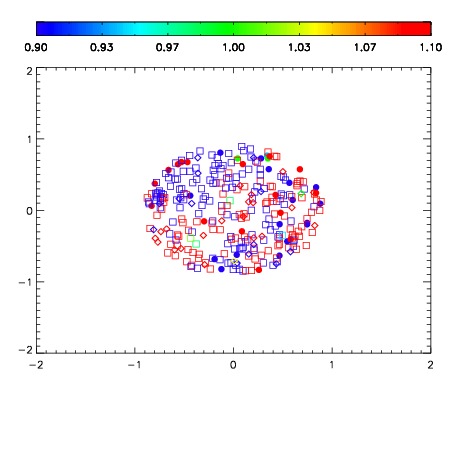


| Frame | Nreads | Zeropoints | Mag plots | Spatial mag deviation | Spatial sky 16325A emission deviations (filled: sky, open: star) | Spatial sky continuum emission | Spatial sky telluric CO2 absorption deviations (filled: H < 10) | |||||||||||||||||||||||
| 0 | 0 |
|
|
|
|
|
|
| IPAIR | NAME | SHIFT | NEWSHIFT | S/N | NAME | SHIFT | NEWSHIFT | S/N |
| 0 | 11940090 | 0.497152 | 0.00000 | 205.146 | 11940089 | -0.00379526 | 0.500947 | 201.937 |
| 1 | 11940087 | 0.494977 | 0.00217500 | 208.643 | 11940085 | -7.45764e-05 | 0.497227 | 204.866 |
| 2 | 11940086 | 0.495179 | 0.00197300 | 203.477 | 11940084 | -0.000442066 | 0.497594 | 200.441 |
| 3 | 11940083 | 0.494912 | 0.00224000 | 201.096 | 11940088 | -0.00434539 | 0.501497 | 199.588 |
| 4 | 11940082 | 0.495582 | 0.00156999 | 196.825 | 11940081 | 0.00000 | 0.497152 | 187.216 |