| Red | Green | Blue | |
| z | 17.63 | ||
| znorm | Inf | ||
| sky | -NaN | -NaN | -Inf |
| S/N | 35.9 | 50.1 | 53.1 |
| S/N(c) | 0.0 | 0.0 | 0.0 |
| SN(E/C) |
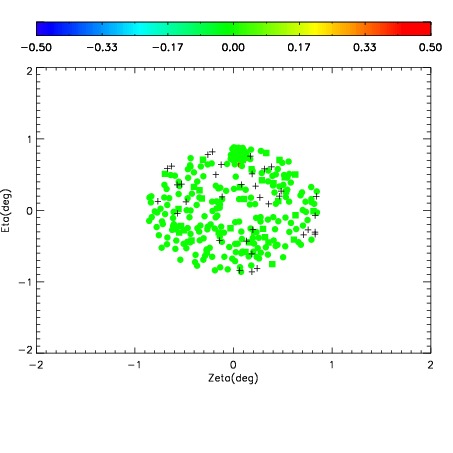
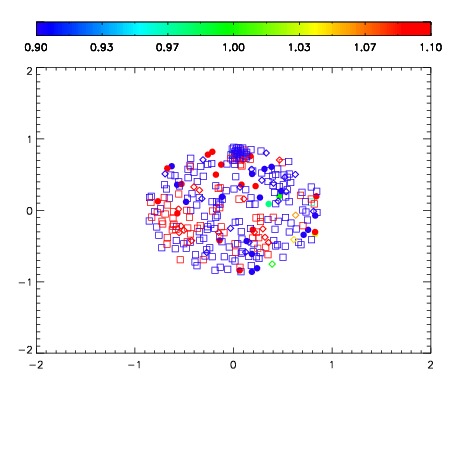
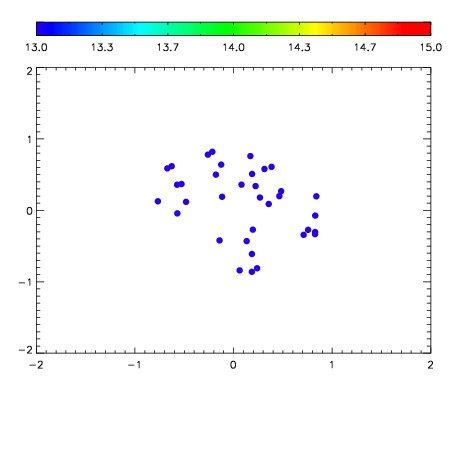

| Frame | Nreads | Zeropoints | Mag plots | Spatial mag deviation | Spatial sky 16325A emission deviations (filled: sky, open: star) | Spatial sky continuum emission | Spatial sky telluric CO2 absorption deviations (filled: H < 10) | |||||||||||||||||||||||
| 0 | 0 |
|
|
|
|
|
|
| IPAIR | NAME | SHIFT | NEWSHIFT | S/N | NAME | SHIFT | NEWSHIFT | S/N |
| 0 | 05230053 | 0.486256 | 0.00000 | 231.067 | 05230051 | -0.00758208 | 0.493838 | 232.510 |
| 1 | 05230052 | 0.485704 | 0.000551999 | 229.743 | 05230050 | -0.00616956 | 0.492426 | 230.983 |
| 2 | 05230049 | 0.485219 | 0.00103700 | 227.570 | 05230054 | -0.00841236 | 0.494668 | 226.698 |
| 3 | 05230048 | 0.485190 | 0.00106600 | 224.325 | 05230047 | 0.00000 | 0.486256 | 223.841 |