| Red | Green | Blue | |
| z | 17.64 | ||
| znorm | Inf | ||
| sky | -NaN | -NaN | -Inf |
| S/N | 28.6 | 39.3 | 44.7 |
| S/N(c) | 0.0 | 0.0 | 0.0 |
| SN(E/C) |
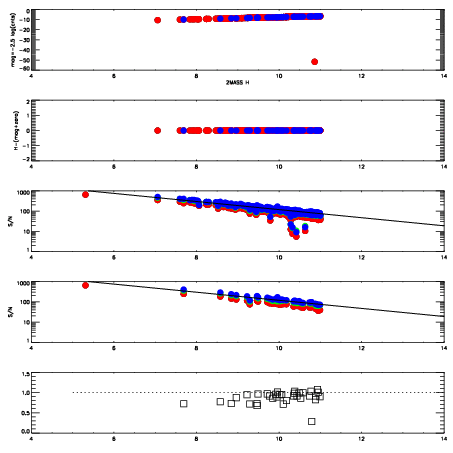
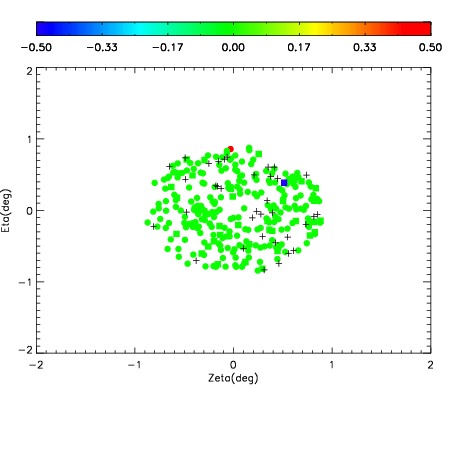
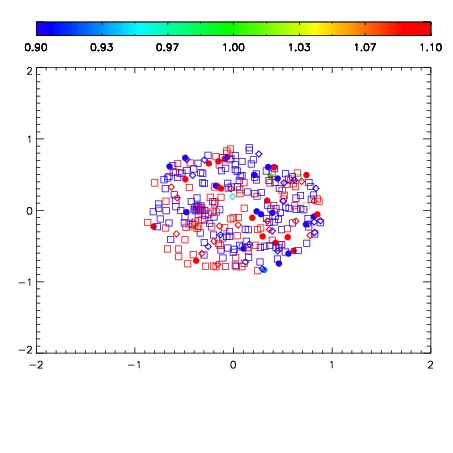
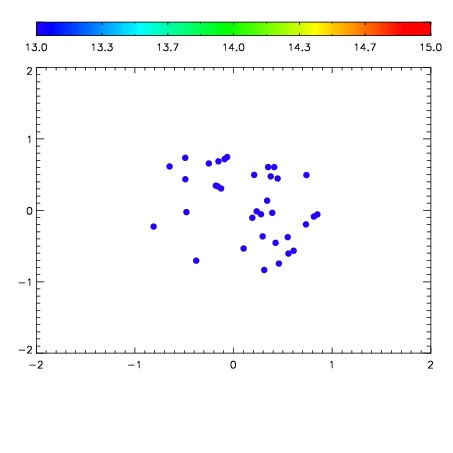

| Frame | Nreads | Zeropoints | Mag plots | Spatial mag deviation | Spatial sky 16325A emission deviations (filled: sky, open: star) | Spatial sky continuum emission | Spatial sky telluric CO2 absorption deviations (filled: H < 10) | |||||||||||||||||||||||
| 0 | 0 |
|
|
|
|
|
|
| IPAIR | NAME | SHIFT | NEWSHIFT | S/N | NAME | SHIFT | NEWSHIFT | S/N |
| 0 | 08810013 | 0.475789 | 0.00000 | 195.831 | 08810011 | 0.00000 | 0.475789 | 186.574 |
| 1 | 08810016 | 0.475601 | 0.000188023 | 209.483 | 08810018 | -0.000964419 | 0.476753 | 199.581 |
| 2 | 08810012 | 0.475316 | 0.000473022 | 202.217 | 08810014 | -0.00176587 | 0.477555 | 192.632 |
| 3 | 08810017 | 0.475665 | 0.000124007 | 201.915 | 08810015 | -0.00110839 | 0.476897 | 192.237 |