| Red | Green | Blue | |
| z | 17.64 | ||
| znorm | Inf | ||
| sky | -Inf | -Inf | -Inf |
| S/N | 30.5 | 44.6 | 47.1 |
| S/N(c) | 0.0 | 0.0 | 0.0 |
| SN(E/C) |

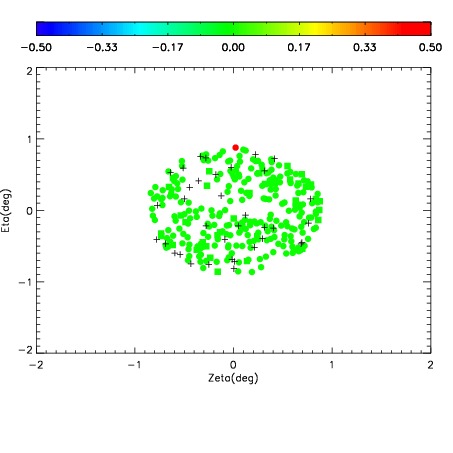
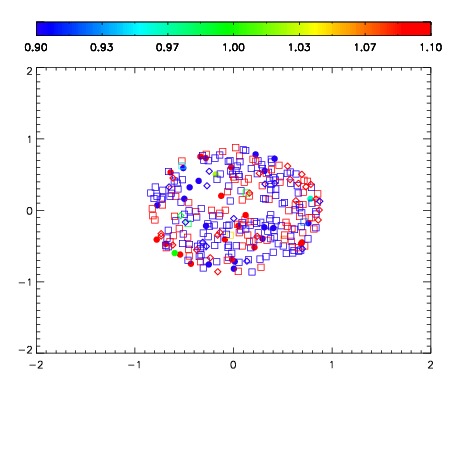


| Frame | Nreads | Zeropoints | Mag plots | Spatial mag deviation | Spatial sky 16325A emission deviations (filled: sky, open: star) | Spatial sky continuum emission | Spatial sky telluric CO2 absorption deviations (filled: H < 10) | |||||||||||||||||||||||
| 0 | 0 |
|
|
|
|
|
|
| IPAIR | NAME | SHIFT | NEWSHIFT | S/N | NAME | SHIFT | NEWSHIFT | S/N |
| 0 | 05220046 | 0.499114 | 0.00000 | 215.735 | 05220047 | 0.0105549 | 0.488559 | 212.107 |
| 1 | 05220045 | 0.497152 | 0.00196201 | 224.731 | 05220040 | 0.00000 | 0.499114 | 220.618 |
| 2 | 05220042 | 0.495855 | 0.00325900 | 224.006 | 05220044 | 0.00642360 | 0.492690 | 220.274 |
| 3 | 05220041 | 0.492656 | 0.00645801 | 222.188 | 05220043 | 0.00512422 | 0.493990 | 217.164 |