| Red | Green | Blue | |
| z | 17.64 | ||
| znorm | Inf | ||
| sky | -Inf | -Inf | -Inf |
| S/N | 36.1 | 50.9 | 52.6 |
| S/N(c) | 0.0 | 0.0 | 0.0 |
| SN(E/C) |
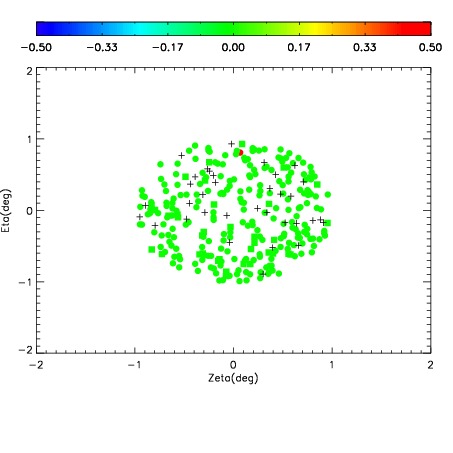
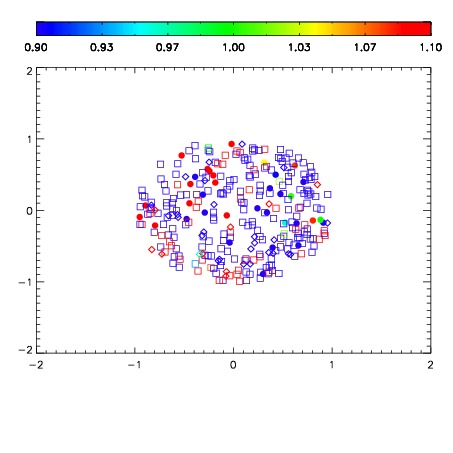
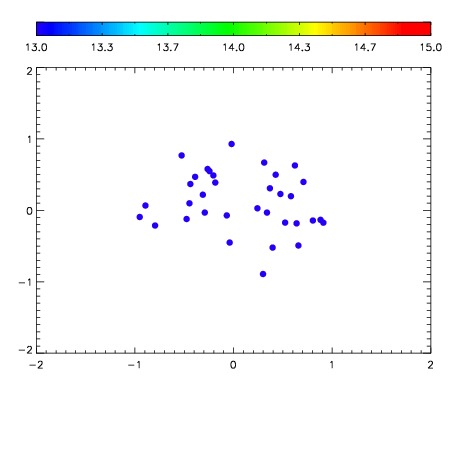

| Frame | Nreads | Zeropoints | Mag plots | Spatial mag deviation | Spatial sky 16325A emission deviations (filled: sky, open: star) | Spatial sky continuum emission | Spatial sky telluric CO2 absorption deviations (filled: H < 10) | |||||||||||||||||||||||
| 0 | 0 |
|
|
|
|
|
|
| IPAIR | NAME | SHIFT | NEWSHIFT | S/N | NAME | SHIFT | NEWSHIFT | S/N |
| 0 | 12520064 | 0.492812 | 0.00000 | 203.478 | 12520059 | 0.00000 | 0.492812 | 215.202 |
| 1 | 12520065 | 0.491901 | 0.000910997 | 238.218 | 12520066 | -0.000753249 | 0.493565 | 238.571 |
| 2 | 12520061 | 0.489915 | 0.00289699 | 226.401 | 12520062 | -0.00335524 | 0.496167 | 228.130 |
| 3 | 12520060 | 0.489402 | 0.00341001 | 218.085 | 12520063 | -0.00248219 | 0.495294 | 219.391 |