| Red | Green | Blue | |
| z | 17.64 | ||
| znorm | Inf | ||
| sky | -NaN | -NaN | -Inf |
| S/N | 34.6 | 48.8 | 51.8 |
| S/N(c) | 0.0 | 0.0 | 0.0 |
| SN(E/C) |
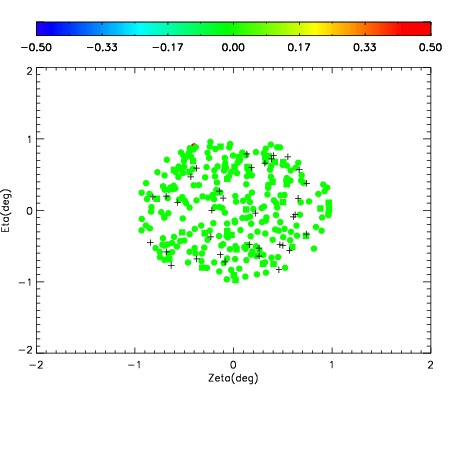
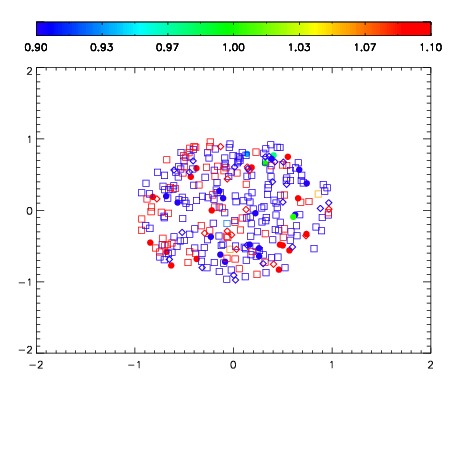


| Frame | Nreads | Zeropoints | Mag plots | Spatial mag deviation | Spatial sky 16325A emission deviations (filled: sky, open: star) | Spatial sky continuum emission | Spatial sky telluric CO2 absorption deviations (filled: H < 10) | |||||||||||||||||||||||
| 0 | 0 |
|
|
|
|
|
|
| IPAIR | NAME | SHIFT | NEWSHIFT | S/N | NAME | SHIFT | NEWSHIFT | S/N |
| 0 | 12500038 | 0.488934 | 0.00000 | 165.064 | 12500037 | 0.00000 | 0.488934 | 174.609 |
| 1 | 12500042 | 0.487017 | 0.00191700 | 219.134 | 12500044 | -0.00452765 | 0.493462 | 217.805 |
| 2 | 12500043 | 0.487126 | 0.00180802 | 217.687 | 12500041 | -0.00353731 | 0.492471 | 211.835 |
| 3 | 12500039 | 0.487522 | 0.00141200 | 215.184 | 12500040 | -0.00300269 | 0.491937 | 211.022 |