| Red | Green | Blue | |
| z | 17.64 | ||
| znorm | Inf | ||
| sky | -Inf | -Inf | -Inf |
| S/N | 30.4 | 48.4 | 51.0 |
| S/N(c) | 0.0 | 0.0 | 0.0 |
| SN(E/C) |
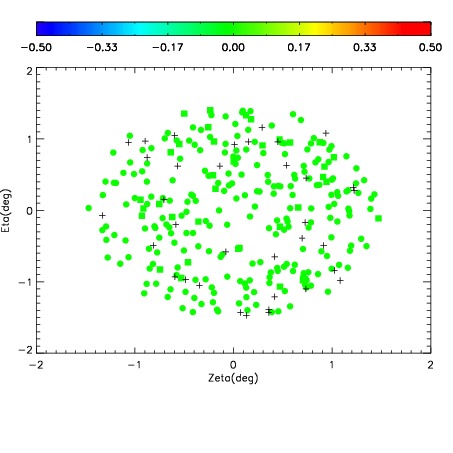
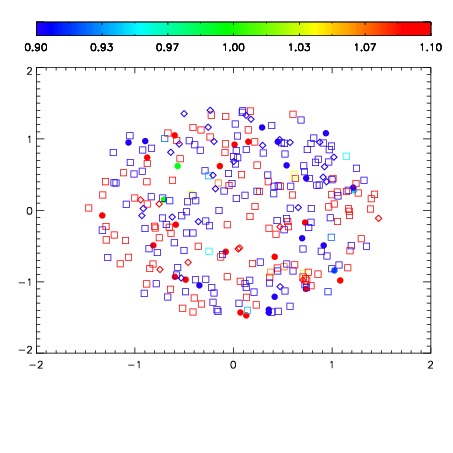


| Frame | Nreads | Zeropoints | Mag plots | Spatial mag deviation | Spatial sky 16325A emission deviations (filled: sky, open: star) | Spatial sky continuum emission | Spatial sky telluric CO2 absorption deviations (filled: H < 10) | |||||||||||||||||||||||
| 0 | 0 |
|
|
|
|
|
|
| IPAIR | NAME | SHIFT | NEWSHIFT | S/N | NAME | SHIFT | NEWSHIFT | S/N |
| 0 | 05200059 | 0.493887 | 0.00000 | 202.716 | 05200061 | 0.00210615 | 0.491781 | 204.300 |
| 1 | 05200060 | 0.493461 | 0.000425994 | 202.055 | 05200058 | 0.00000 | 0.493887 | 201.145 |
| 2 | 05200064 | 0.491994 | 0.00189301 | 198.436 | 05200062 | 0.00116325 | 0.492724 | 200.540 |
| 3 | 05200063 | 0.491947 | 0.00194001 | 197.256 | 05200065 | 3.62122e-05 | 0.493851 | 200.156 |