| Red | Green | Blue | |
| z | 17.64 | ||
| znorm | Inf | ||
| sky | -Inf | -NaN | -Inf |
| S/N | 23.1 | 39.3 | 42.6 |
| S/N(c) | 0.0 | 0.0 | 0.0 |
| SN(E/C) |
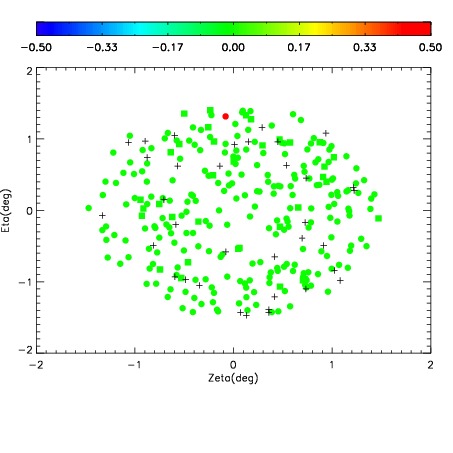
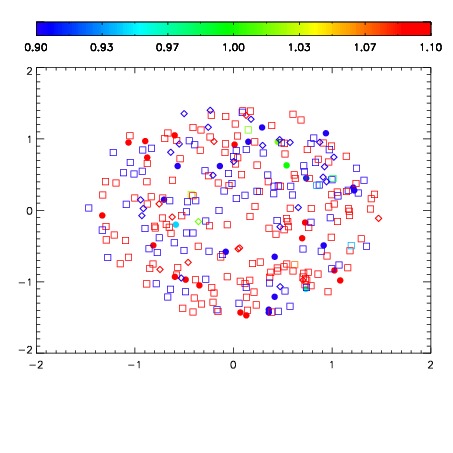
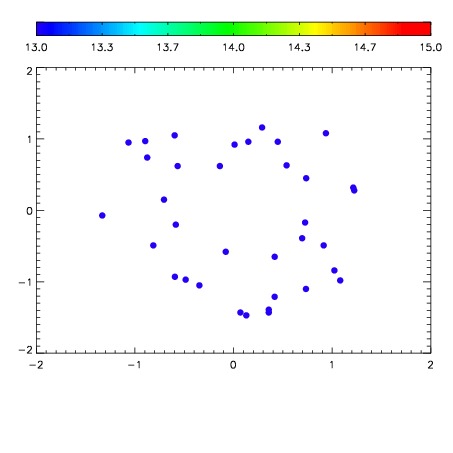

| Frame | Nreads | Zeropoints | Mag plots | Spatial mag deviation | Spatial sky 16325A emission deviations (filled: sky, open: star) | Spatial sky continuum emission | Spatial sky telluric CO2 absorption deviations (filled: H < 10) | |||||||||||||||||||||||
| 0 | 0 |
|
|
|
|
|
|
| IPAIR | NAME | SHIFT | NEWSHIFT | S/N | NAME | SHIFT | NEWSHIFT | S/N |
| 0 | 05480042 | 0.489329 | 0.00000 | 174.577 | 05480043 | 0.00421682 | 0.485112 | 169.116 |
| 1 | 05480037 | 0.484622 | 0.00470701 | 168.769 | 05480039 | 0.000375898 | 0.488953 | 165.979 |
| 2 | 05480041 | 0.488206 | 0.00112301 | 168.223 | 05480040 | 0.00217158 | 0.487157 | 164.913 |
| 3 | 05480038 | 0.487867 | 0.00146201 | 167.969 | 05480036 | 0.00000 | 0.489329 | 162.774 |