| Red | Green | Blue | |
| z | 17.64 | ||
| znorm | Inf | ||
| sky | -Inf | -NaN | -Inf |
| S/N | 27.4 | 44.5 | 47.0 |
| S/N(c) | 0.0 | 0.0 | 0.0 |
| SN(E/C) |
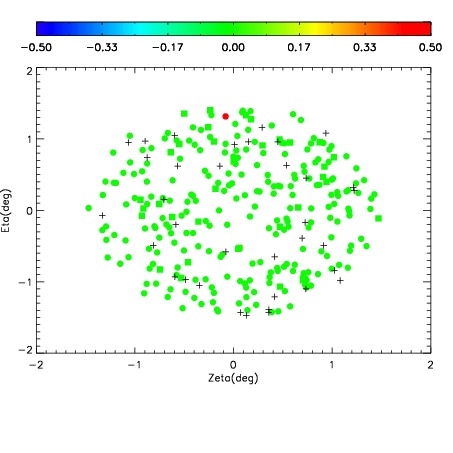
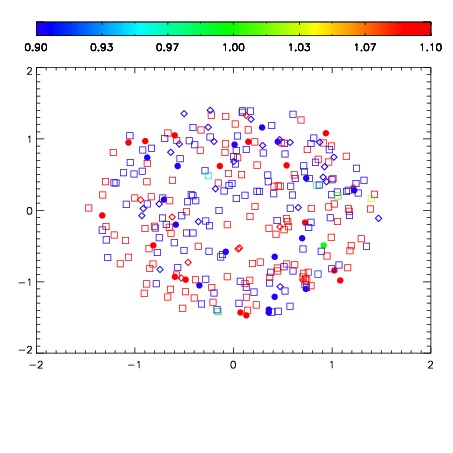
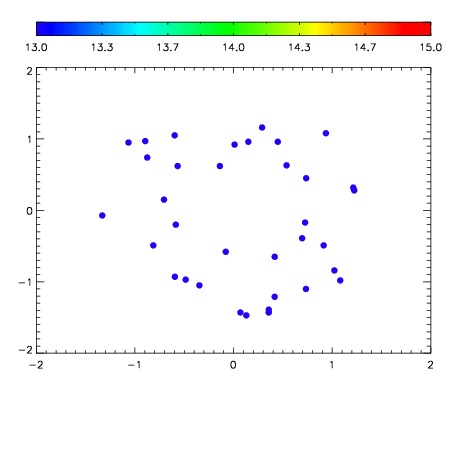

| Frame | Nreads | Zeropoints | Mag plots | Spatial mag deviation | Spatial sky 16325A emission deviations (filled: sky, open: star) | Spatial sky continuum emission | Spatial sky telluric CO2 absorption deviations (filled: H < 10) | |||||||||||||||||||||||
| 0 | 0 |
|
|
|
|
|
|
| IPAIR | NAME | SHIFT | NEWSHIFT | S/N | NAME | SHIFT | NEWSHIFT | S/N |
| 0 | 06100016 | 0.487185 | 0.00000 | 161.783 | 06100017 | 0.00313775 | 0.484047 | 162.512 |
| 1 | 06100012 | 0.485815 | 0.00137001 | 171.475 | 06100010 | 0.00000 | 0.487185 | 173.954 |
| 2 | 06100011 | 0.484755 | 0.00242999 | 170.225 | 06100014 | 0.00383743 | 0.483348 | 169.189 |
| 3 | 06100015 | 0.486436 | 0.000748992 | 168.632 | 06100013 | 0.00401900 | 0.483166 | 168.555 |