| Red | Green | Blue | |
| z | 17.64 | ||
| znorm | Inf | ||
| sky | -Inf | -Inf | -Inf |
| S/N | 24.8 | 41.0 | 43.1 |
| S/N(c) | 0.0 | 0.0 | 0.0 |
| SN(E/C) |
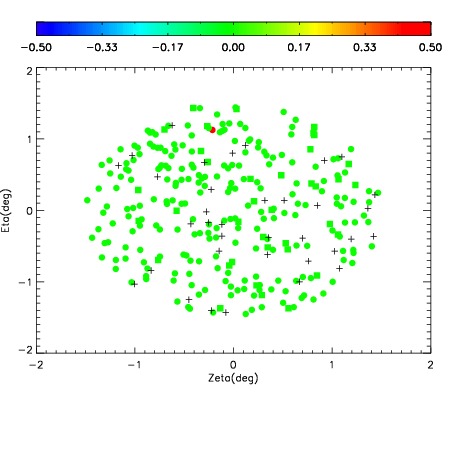

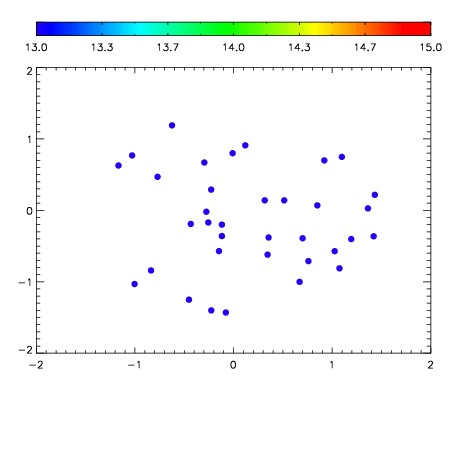

| Frame | Nreads | Zeropoints | Mag plots | Spatial mag deviation | Spatial sky 16325A emission deviations (filled: sky, open: star) | Spatial sky continuum emission | Spatial sky telluric CO2 absorption deviations (filled: H < 10) | |||||||||||||||||||||||
| 0 | 0 |
|
|
|
|
|
|
| IPAIR | NAME | SHIFT | NEWSHIFT | S/N | NAME | SHIFT | NEWSHIFT | S/N |
| 0 | 04880061 | 0.496650 | 0.00000 | 202.517 | 04880063 | 0.000365116 | 0.496285 | 206.481 |
| 1 | 04880065 | 0.493365 | 0.00328502 | 212.442 | 04880066 | 0.00127664 | 0.495373 | 208.811 |
| 2 | 04880064 | 0.493324 | 0.00332600 | 207.676 | 04880059 | 0.00000 | 0.496650 | 207.438 |
| 3 | 04880060 | 0.493008 | 0.00364202 | 201.726 | 04880062 | -0.000591493 | 0.497241 | 202.508 |