| Red | Green | Blue | |
| z | 17.64 | ||
| znorm | Inf | ||
| sky | -Inf | -Inf | -Inf |
| S/N | 27.9 | 46.5 | 50.2 |
| S/N(c) | 0.0 | 0.0 | 0.0 |
| SN(E/C) |
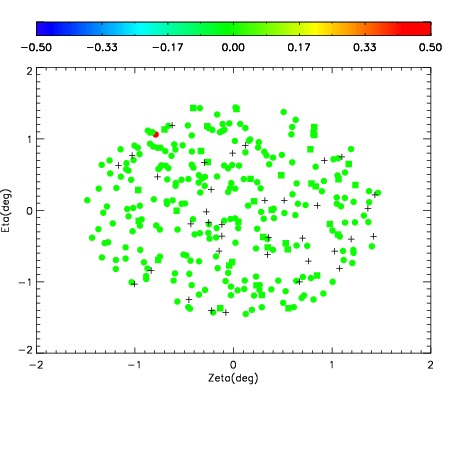
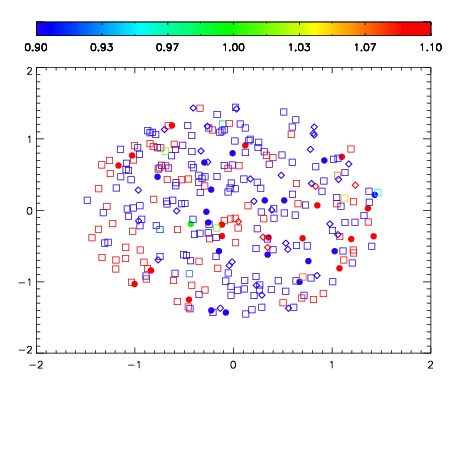
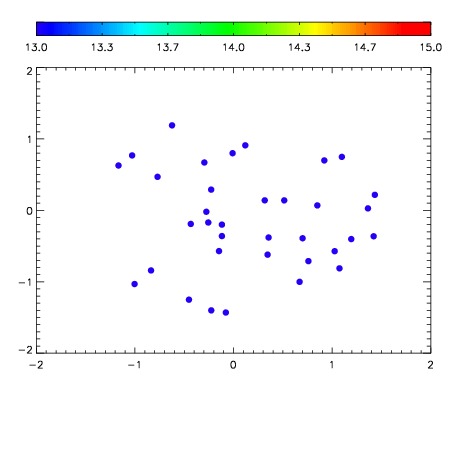

| Frame | Nreads | Zeropoints | Mag plots | Spatial mag deviation | Spatial sky 16325A emission deviations (filled: sky, open: star) | Spatial sky continuum emission | Spatial sky telluric CO2 absorption deviations (filled: H < 10) | |||||||||||||||||||||||
| 0 | 0 |
|
|
|
|
|
|
| IPAIR | NAME | SHIFT | NEWSHIFT | S/N | NAME | SHIFT | NEWSHIFT | S/N |
| 0 | 09080049 | 0.478579 | 0.00000 | 219.551 | 09080048 | 0.00000 | 0.478579 | 219.317 |
| 1 | 09080054 | 0.476715 | 0.00186402 | 230.202 | 09080055 | -4.50400e-05 | 0.478624 | 227.384 |
| 2 | 09080053 | 0.476280 | 0.00229901 | 228.631 | 09080052 | 0.00109165 | 0.477487 | 224.569 |
| 3 | 09080050 | 0.477961 | 0.000618011 | 223.570 | 09080051 | 0.00127662 | 0.477302 | 224.367 |